Bollinger Bands explained
Bollinger Bands, developed in the 1980s by the renowned trader John Bollinger, are a technical analysis tool that traders use in price charts across various markets to visualise overbought and oversold conditions, market volatility, potential reversals, and trade entry and exit points. The underlying concept is that the price of an asset will revert to its average over time.
What are Bollinger bands?
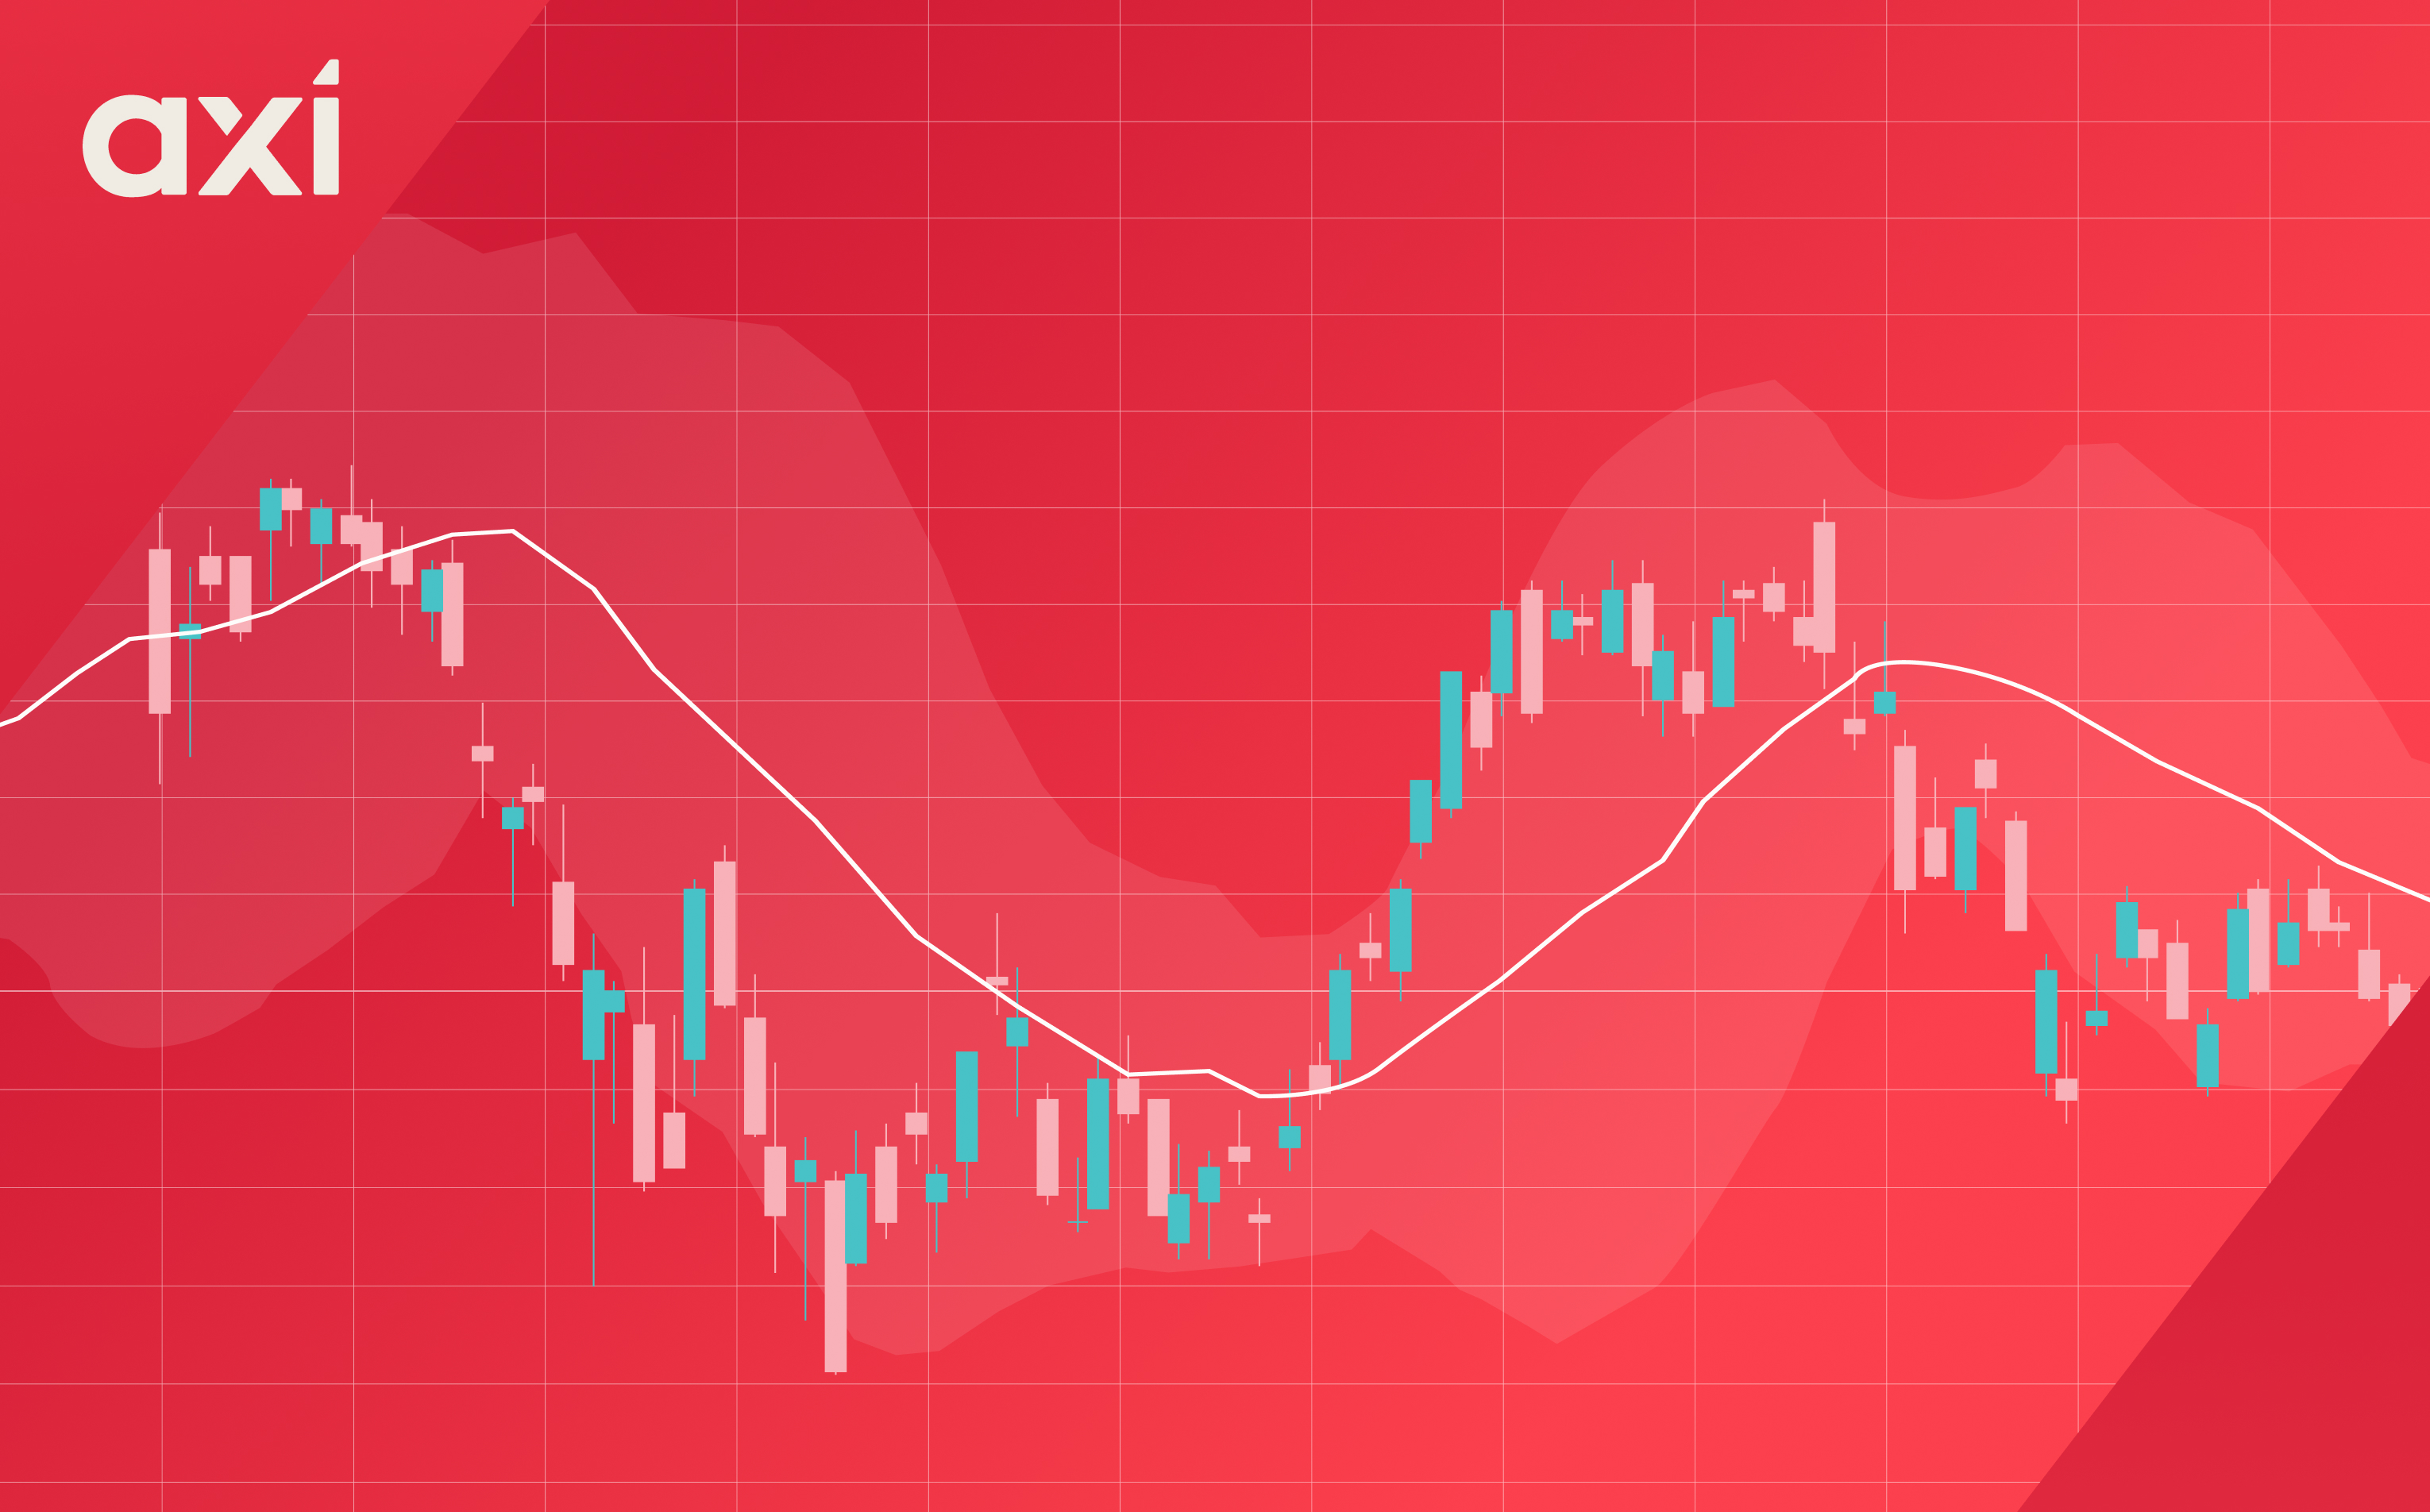
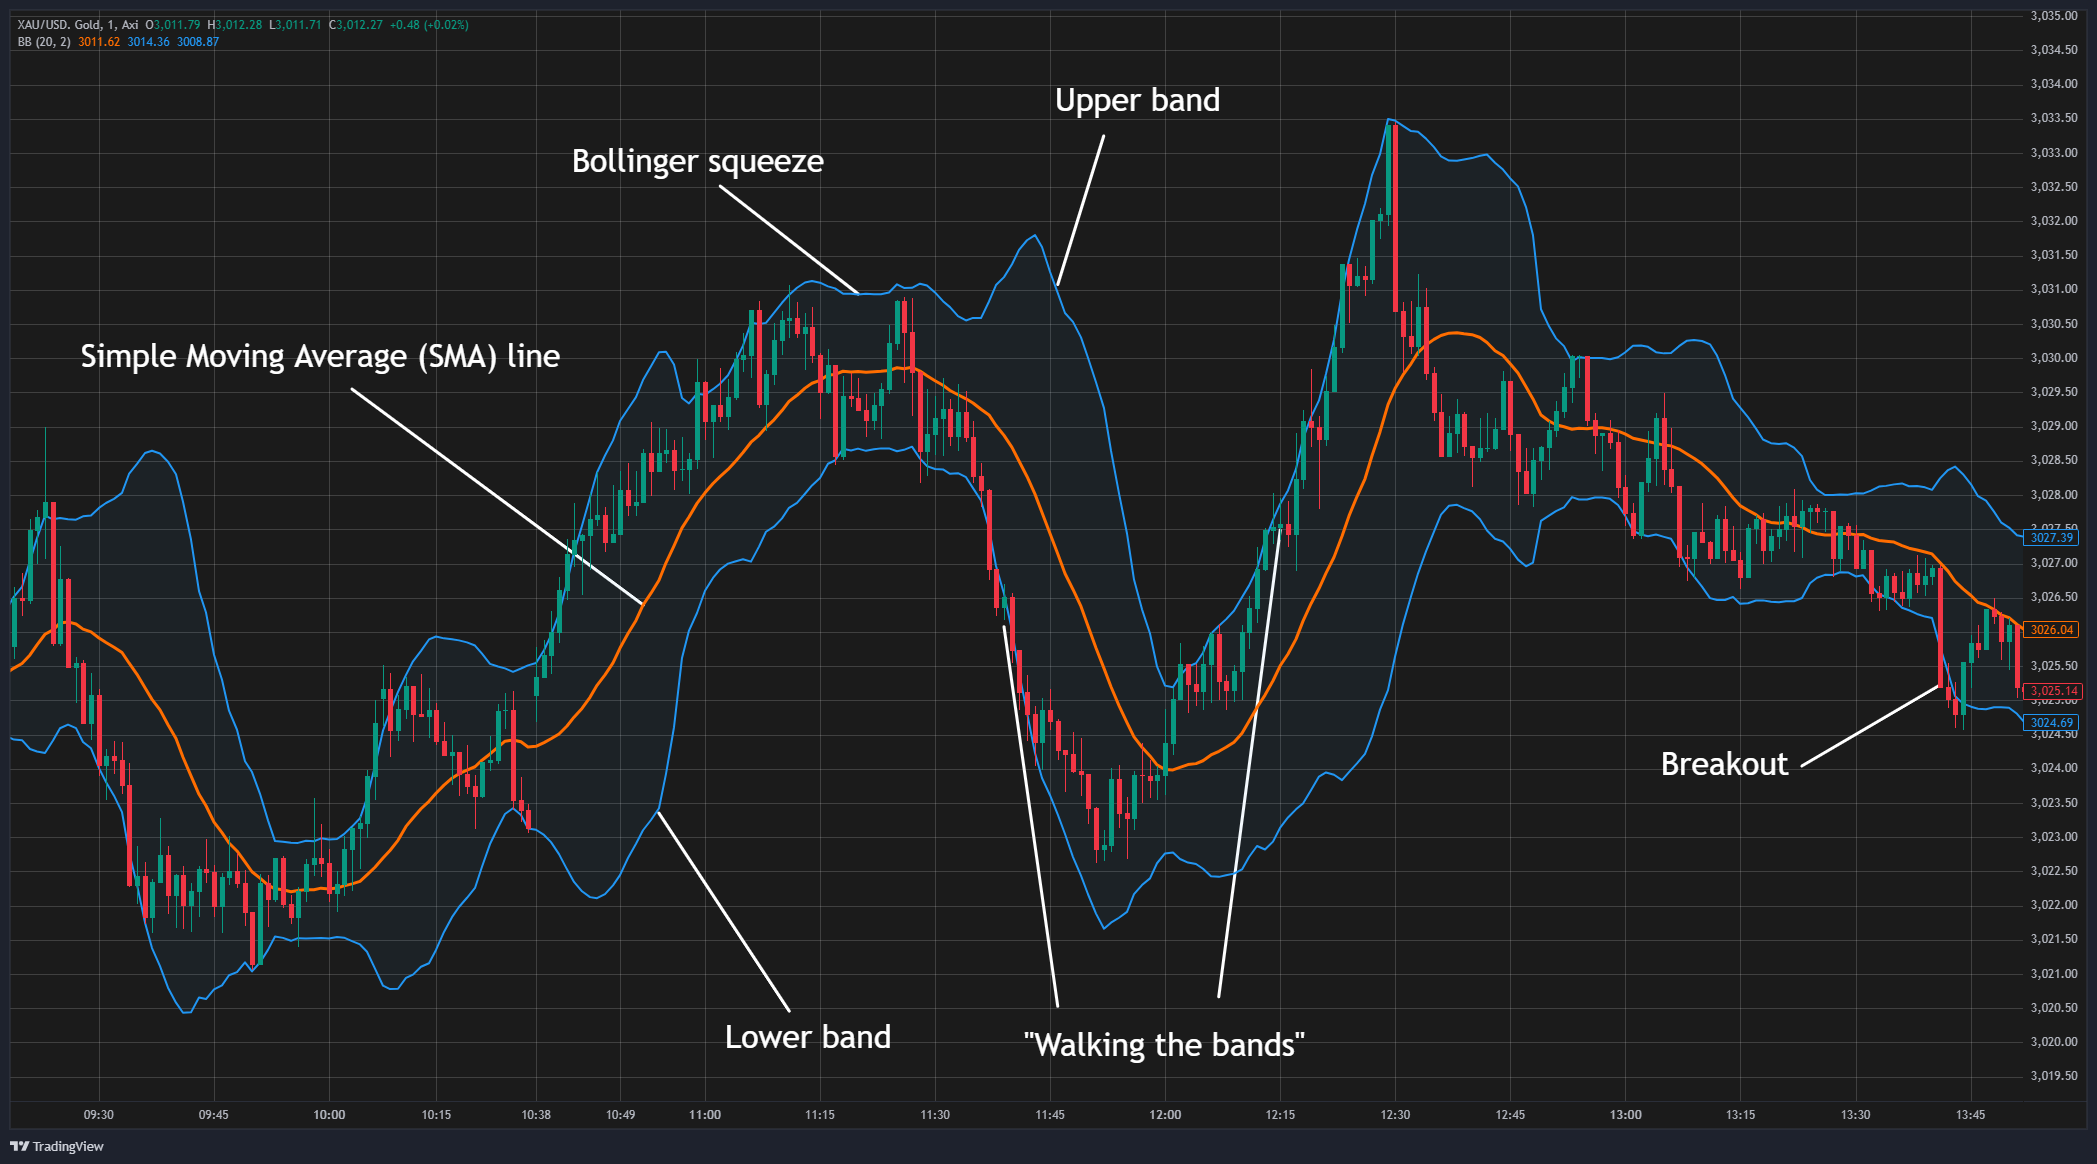
Bollinger Bands consist of three lines:
- A central Simple Moving Average (SMA) line, typically a 20-day SMA by default.
- Two outer bands, an upper and lower band, positioned two standard deviations (SD) above and below the SMA. These bands expand and contract in response to market volatility.
During periods of normal market activity, prices generally remain within the bands. When prices approach or exceed the bands, that indicates heightened volatility and potential trading opportunities.
How are Bollinger bands calculated?
Bollinger Bands are calculated using the standard deviation (SD) from a simple moving average (SMA). The SMA represents the average price over a specific period, with 20 periods being the default on platforms like TradingView. The SD, which reflects price volatility, is then added to and subtracted from the SMA to form the upper and lower bands, respectively. Consequently, the more the volatility, the wider the bands, while decreased volatility leads to narrower bands.
Bollinger bands formula
The Bollinger Bands formula consists of three parts, calculated using a 20-day SMA as the standard:
- Middle band = 20-day SMA
- Upper band = 20-day SMA + (20-day SD x 2)
- Lower band = 20-day SMA – (20-day SD x 2)
How to read Bollinger bands
To interpret Bollinger Bands, traders analyse the expansion and contraction of the bands relative to price movements. Bollinger Bands do not guarantee immediate signal reversals upon touching the bands; rather, they offer insight into potential price extremes and volatility levels.
In times of low volatility, the bands contract, indicating consolidation, known as a "Bollinger squeeze". Traders typically prepare for breakout scenarios during these periods.
Conversely, when volatility increases following a breakout or another similar event, the bands expand. Prices tend to move towards or beyond the bands. A price reaching the upper band signals a potential overbought condition, while touching the lower band suggests the market may be oversold.
"Walking the bands" refers to a price pattern where an asset consistently touches or moves along the outer Bollinger Bands, signalling a strong trend. However, "walking the bands" can also indicate overextension or a trend's potential reversal. Traders often use this concept to gauge momentum and determine whether a market is either "overbought" (walking the upper band) or "oversold" (walking the lower band).
How to use Bollinger bands in trading
Traders use Bollinger Bands to identify overbought or oversold conditions, monitor volatility, and adjust their position sizes accordingly to manage risk. Common strategies incorporating Bollinger Bands, often combined with additional technical indicators like RSI, MACD, or candlestick patterns for confirmation, include:
The Bollinger Squeeze: This capitalises on the potential for significant breakouts following periods of low volatility, as indicated by contracting bands. Once the price breaks decisively above the upper band or below the lower band, traders enter positions in the direction of the breakout.
Trend Following: In trending markets, traders anticipate price bounces off the MA line towards the outer band. Therefore, they open positions in the direction of the trend (bullish above the SMA and bearish below).
Mean Reversion: In range-bound markets, Bollinger Bands help identify overbought and oversold conditions, signalling potential reversals. Traders may initiate short positions when the price reaches the upper band and long positions when it reaches the lower band.
Pros and cons of Bollinger Bands
Pros
Bollinger Bands provide an intuitive and effective visual interpretation of volatility, making them accessible to traders of all experience levels. They are versatile, work across multiple timeframes and markets, and assist in anticipating breakouts.
Cons
As Bollinger Bands are based on historical price data, they are a lagging indicator, potentially delaying signals, particularly in volatile markets. They can also sometimes generate false signals; price might not always follow through after touching or breaching the bands. Also, prices can frequently stay near the bands during strong trends, causing multiple false reversal signals.
Finally, Bollinger Bands are not effective as standalone indicators and often need additional confirmation tools to validate signals.
Summary
Bollinger Bands are valuable technical analysis tools used to visualise market trends and volatility, identify potential reversal points, and determine entry and exit points for trades. They are made up of a central SMA line and two outer bands, positioned two standard deviations away. Traders use them to monitor volatility, adjust position sizes, and anticipate breakouts. However, as lagging indicators based on historical data, they can at times produce false signals - making them most effective when interpreted within a broader market context and supported by additional confirmation tools.
Ready to trade your edge?
Join thousands of traders and trade CFDs on forex, shares, indices, commodities, and cryptocurrencies!
This information is not to be construed as a recommendation; or an offer to buy or sell; or the solicitation of an offer to buy or sell any security, financial product, or instrument; or to participate in any trading strategy. It has been prepared without taking your objectives, financial situation and needs into account. Any references to past performance and forecasts are not reliable indicators of future results. Axi makes no representation and assumes no liability with regard to the accuracy and completeness of the content in this publication. Readers should seek their own advice.

Alex Macris
With a background spanning forex, stocks, and crypto, Alex has contributed financial and stock exchange reports to leading publications and news agencies. Beyond financial markets, he honed his skills by researching and editing international agreements and state reports and producing multimedia resources for diverse brands and organisations.
In addition to written content, Alex, who is fluent in English, French, and Greek, brings extensive experience and passion for audio. His portfolio showcases a versatile skill set encompassing podcast production, educational materials, and advertisements. A team player and lifelong learner, he maintains a balanced perspective on both the big picture and the finer details.
Find him on: LinkedIn