What are harmonic patterns?
Harmonic patterns are chart patterns based on Fibonacci numbers, used by traders to identify potential trend reversals. The major harmonic patterns include: ABCD, Bat, Gartley, Butterfly, Crab, Deep Crab, and Shark.
Unlike classic chart patterns, which allow for more subjectivity, harmonic patterns require precise calculations. As with most chart patterns, harmonic patterns are rarely used on their own. Instead, they’re typically combined with technical indicators and other tools for confirmation.
Do they work?
Harmonic patterns can be helpful in identifying potential trend reversals and trading opportunities. However, chart patterns can produce wrong signals, which is why it is important to use additional tools rather than just relying on the pattern alone. Their accuracy also depends on the market conditions (ranging or trending). Harmonic patterns are less beginner-friendly compared to patterns like triangles or pennants, which are easier to understand and draw. Beginners might find it beneficial to start with more recognizable patterns like Gartley and Bat.
Before using harmonic patterns, it is crucial to understand the concept of Fibonacci retracements and extensions, key components of these formations. These levels are derived from the Fibonacci sequence, a series in which each number is the sum of the two preceding ones. Key Fibonacci levels include:
- 38.2% retracement
- 50% retracement (not technically a Fibonacci ratio, but widely used)
- 61.8% retracement
- 78.6% retracement
- 88.6% retracement
- 127.2% extension
- 161.8% extension
Harmonic pattern types
The ABCD pattern
This pattern consists of four points (A, B, C, D) and the following legs:
- AB: Initial price move
- BC: Retracement
- CD: Extension, typically similar in length and time to AB
Bullish example: Price declines (AB), retraces upward (BC), and drops again (CD), matching AB. A long position is entered at point D.
Bearish example: Price rises (AB), retraces downward (BC), and rises again (CD), matching AB. A short position is entered at point D.
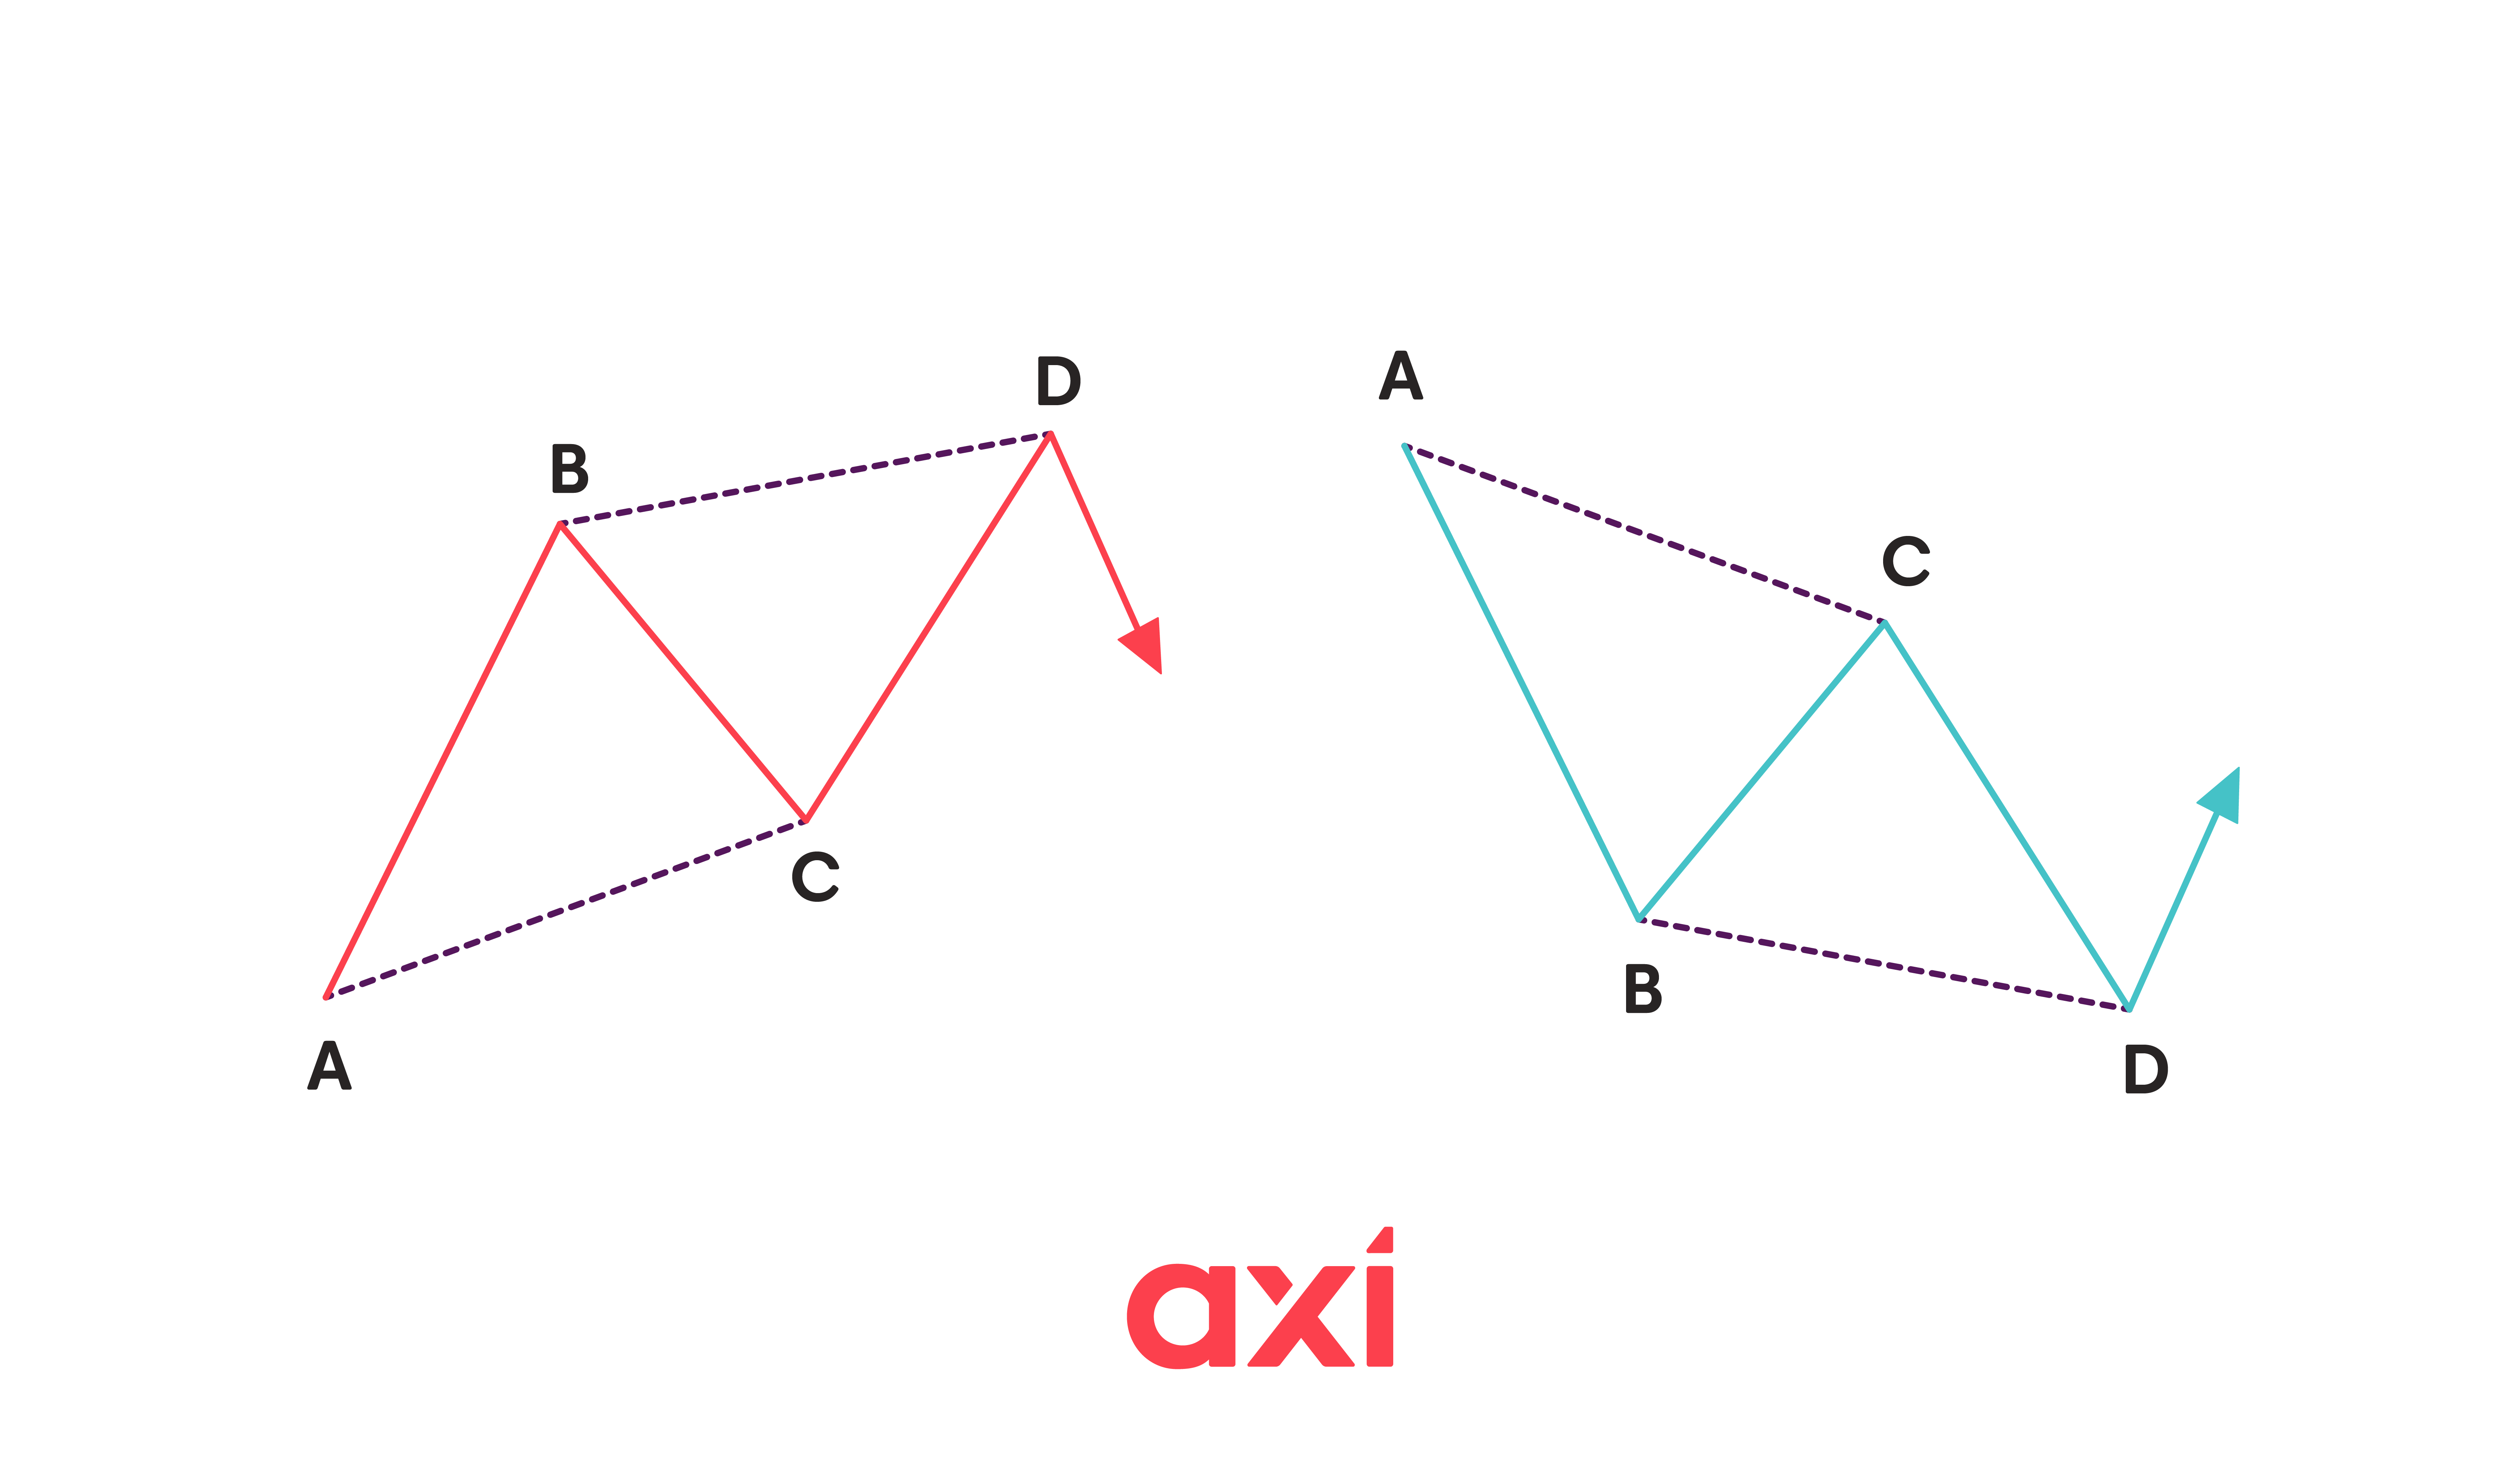 Bearish and bullish ABCD patterns
The Bat pattern
- AB = 38.2% to 50% of XA
- BC = 38.2% to 88.6% of AB
- CD = 88.6% of XA
- If BC is 38.2% of AB, CD should be a 161.8% extension of BC
- If BC is 88.6% of AB, CD should be a 261.8% extension of BC
Bullish Bat: XA is the initial rise, AB a mild pullback, BC another rise, CD a decline with D marking the entry point for a buy trade.
Bearish Bat: XA is the initial drop, AB a mild recovery, BC another decline, CD the final rise with D marking the entry point for a sell trade.
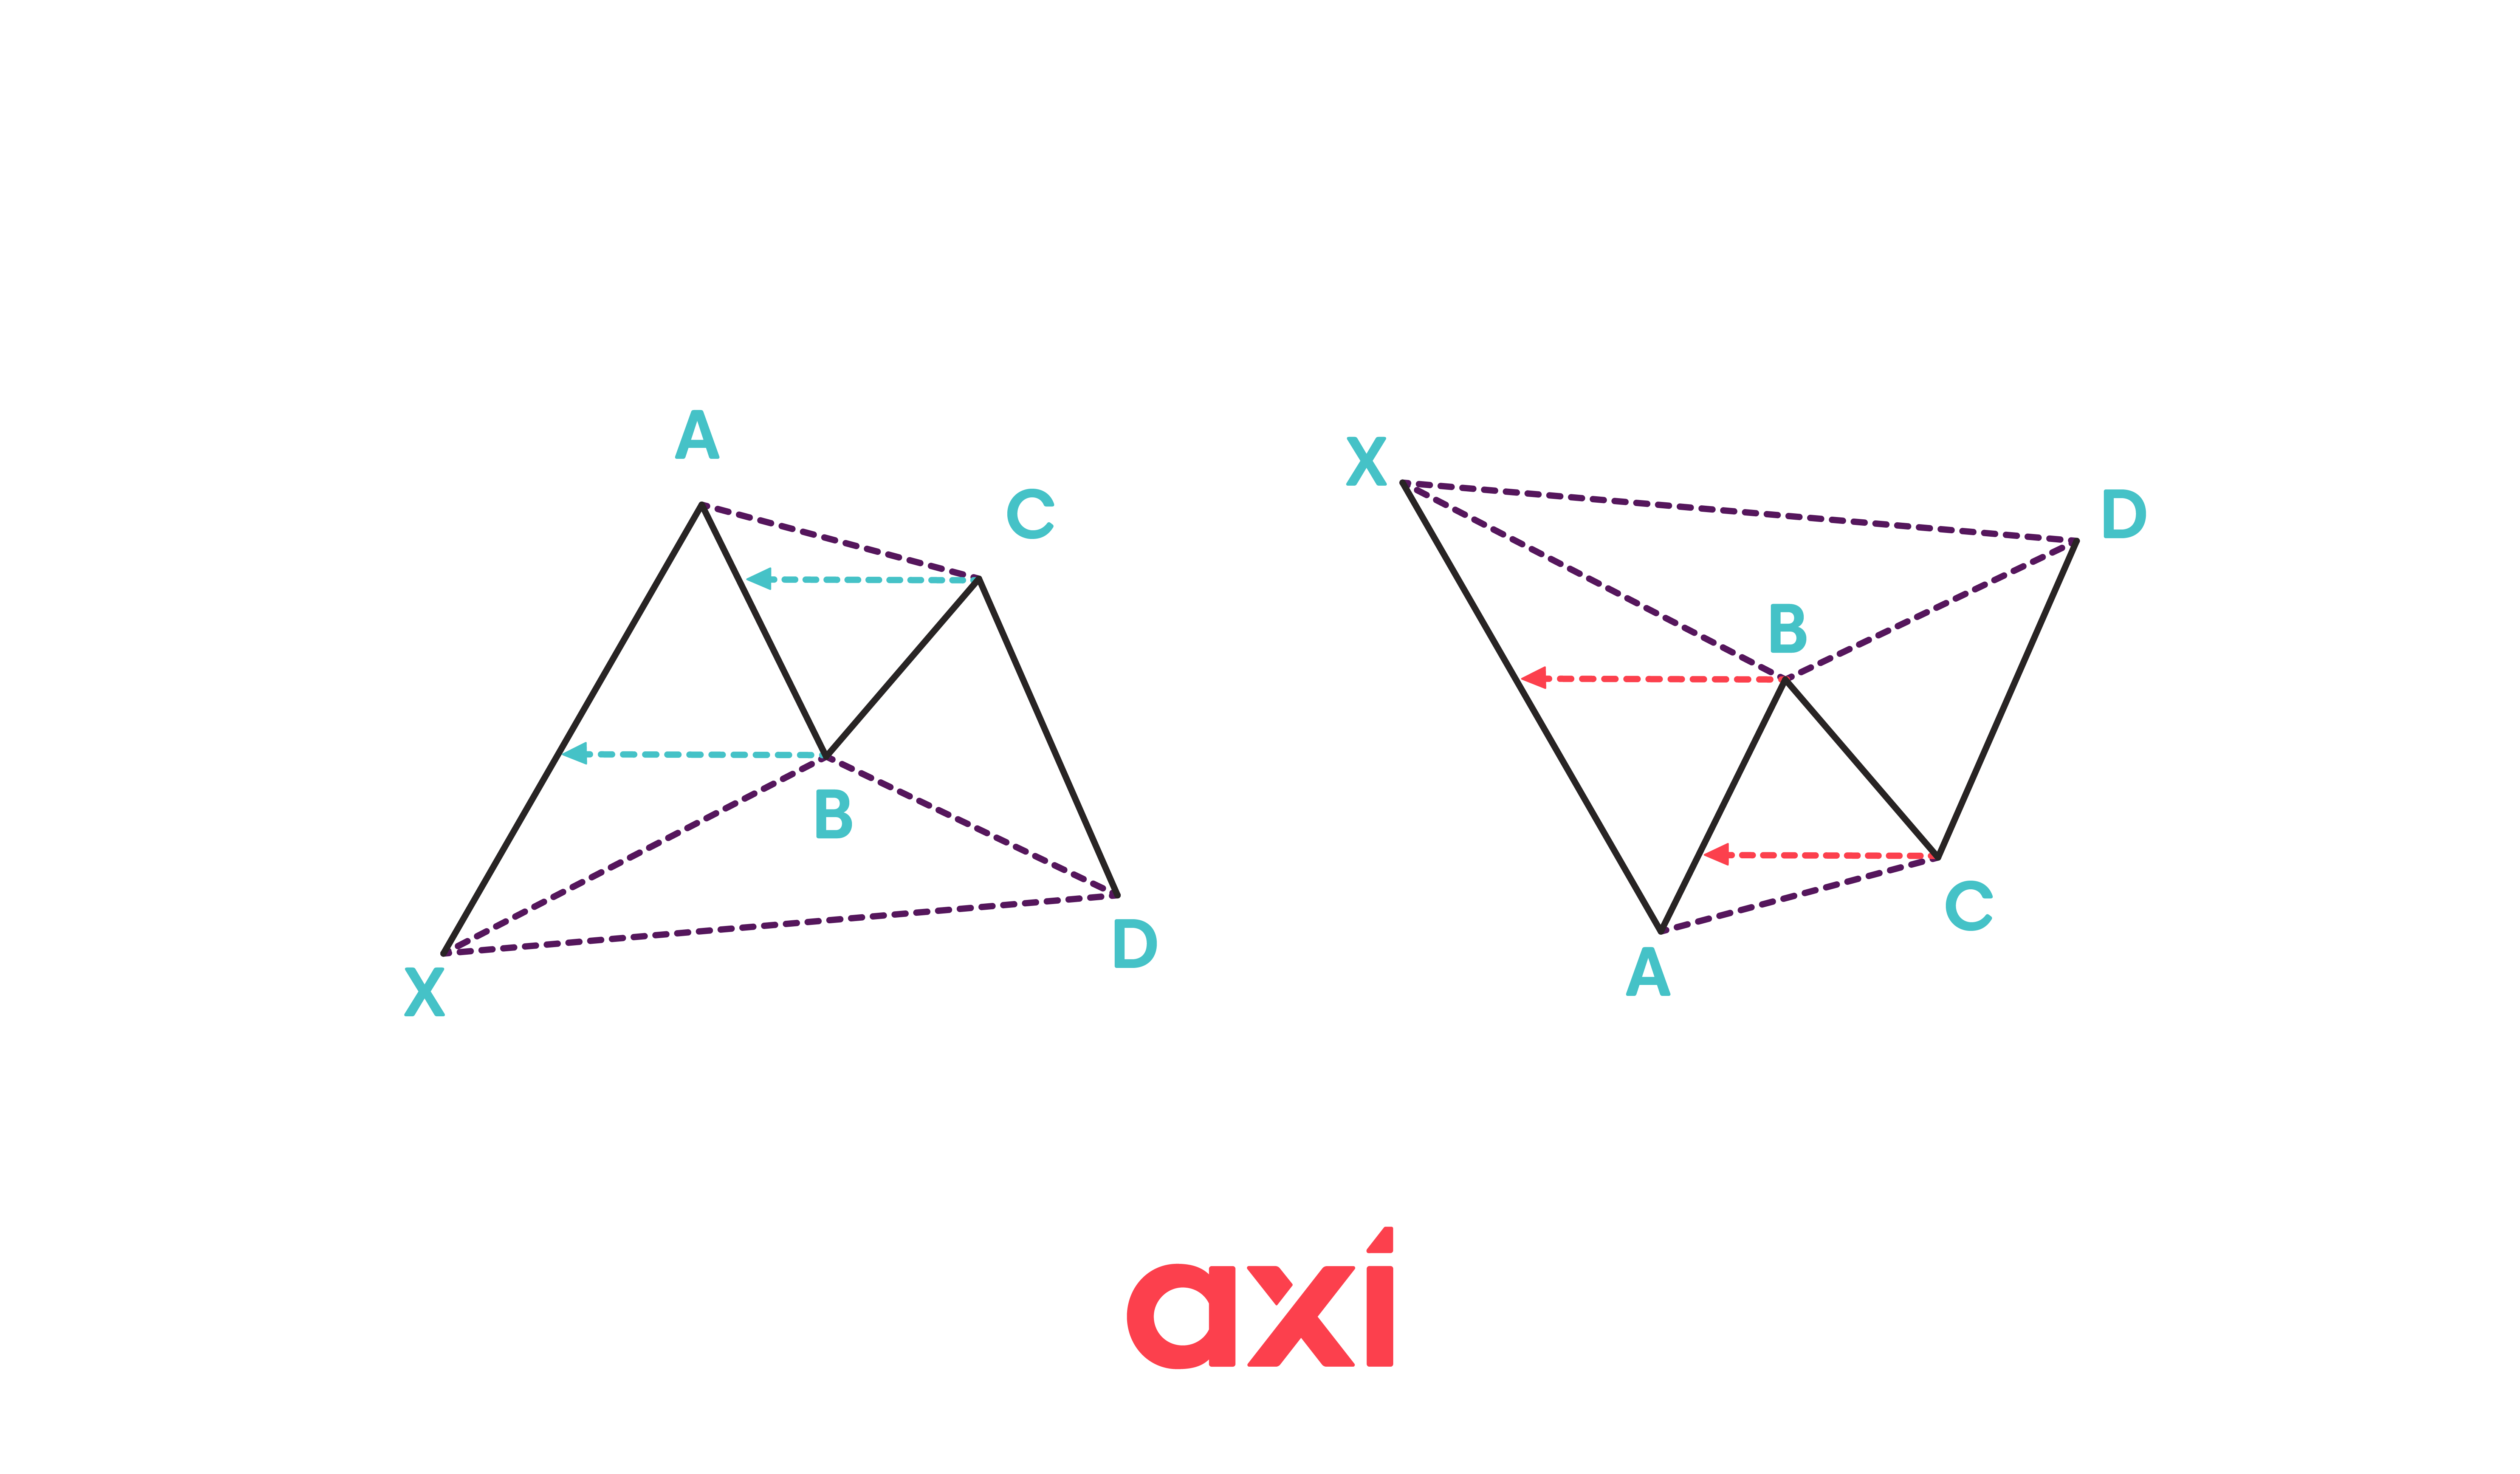 Bullish and bearish bat patterns
The Butterfly pattern
Also a five-point pattern: X, A, B, C, D. Unlike the Bat, point D extends beyond X.
- AB = 78.6% of XA
- BC = 38.2% or 88.6% of AB
- CD = 127% to 161.8% extension of XA
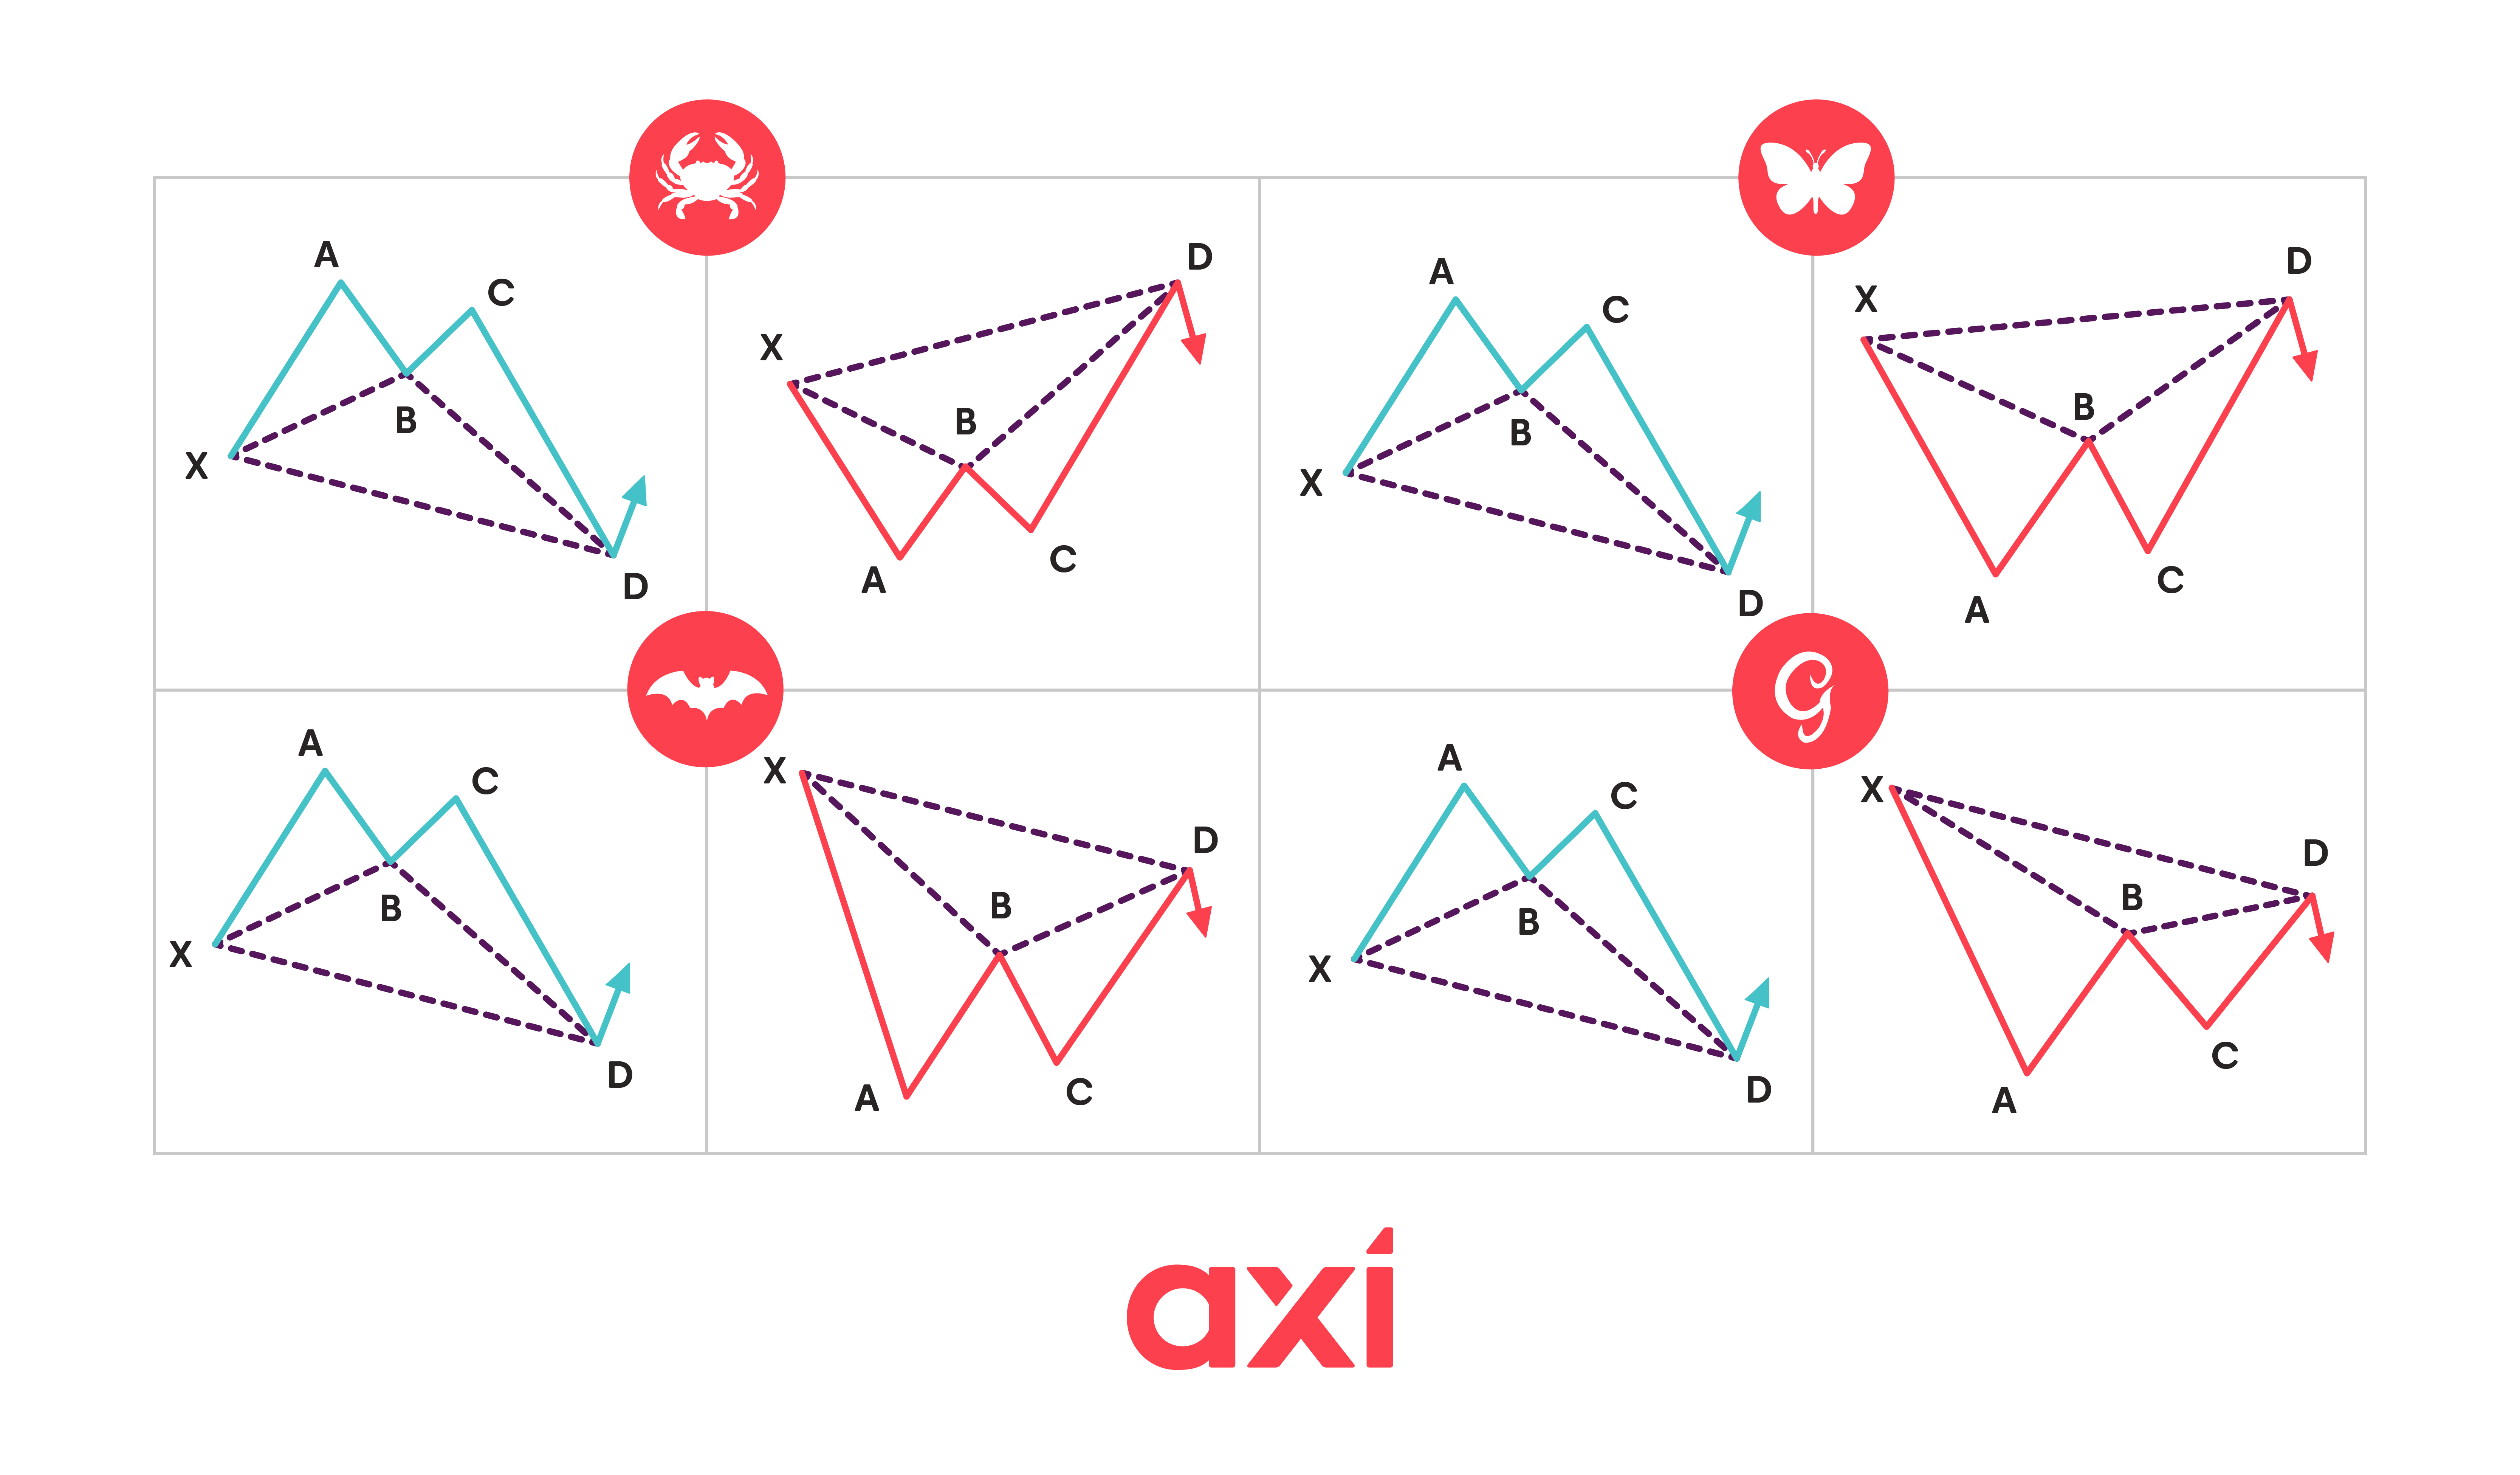
Bullish example: XA rises, AB retraces 78.6%, BC rises, and CD extends past X. D is the long entry.
Bearish example: XA drops, AB retraces 78.6% of XA, BC drops again, and CD extends beyond X. D is the short entry.
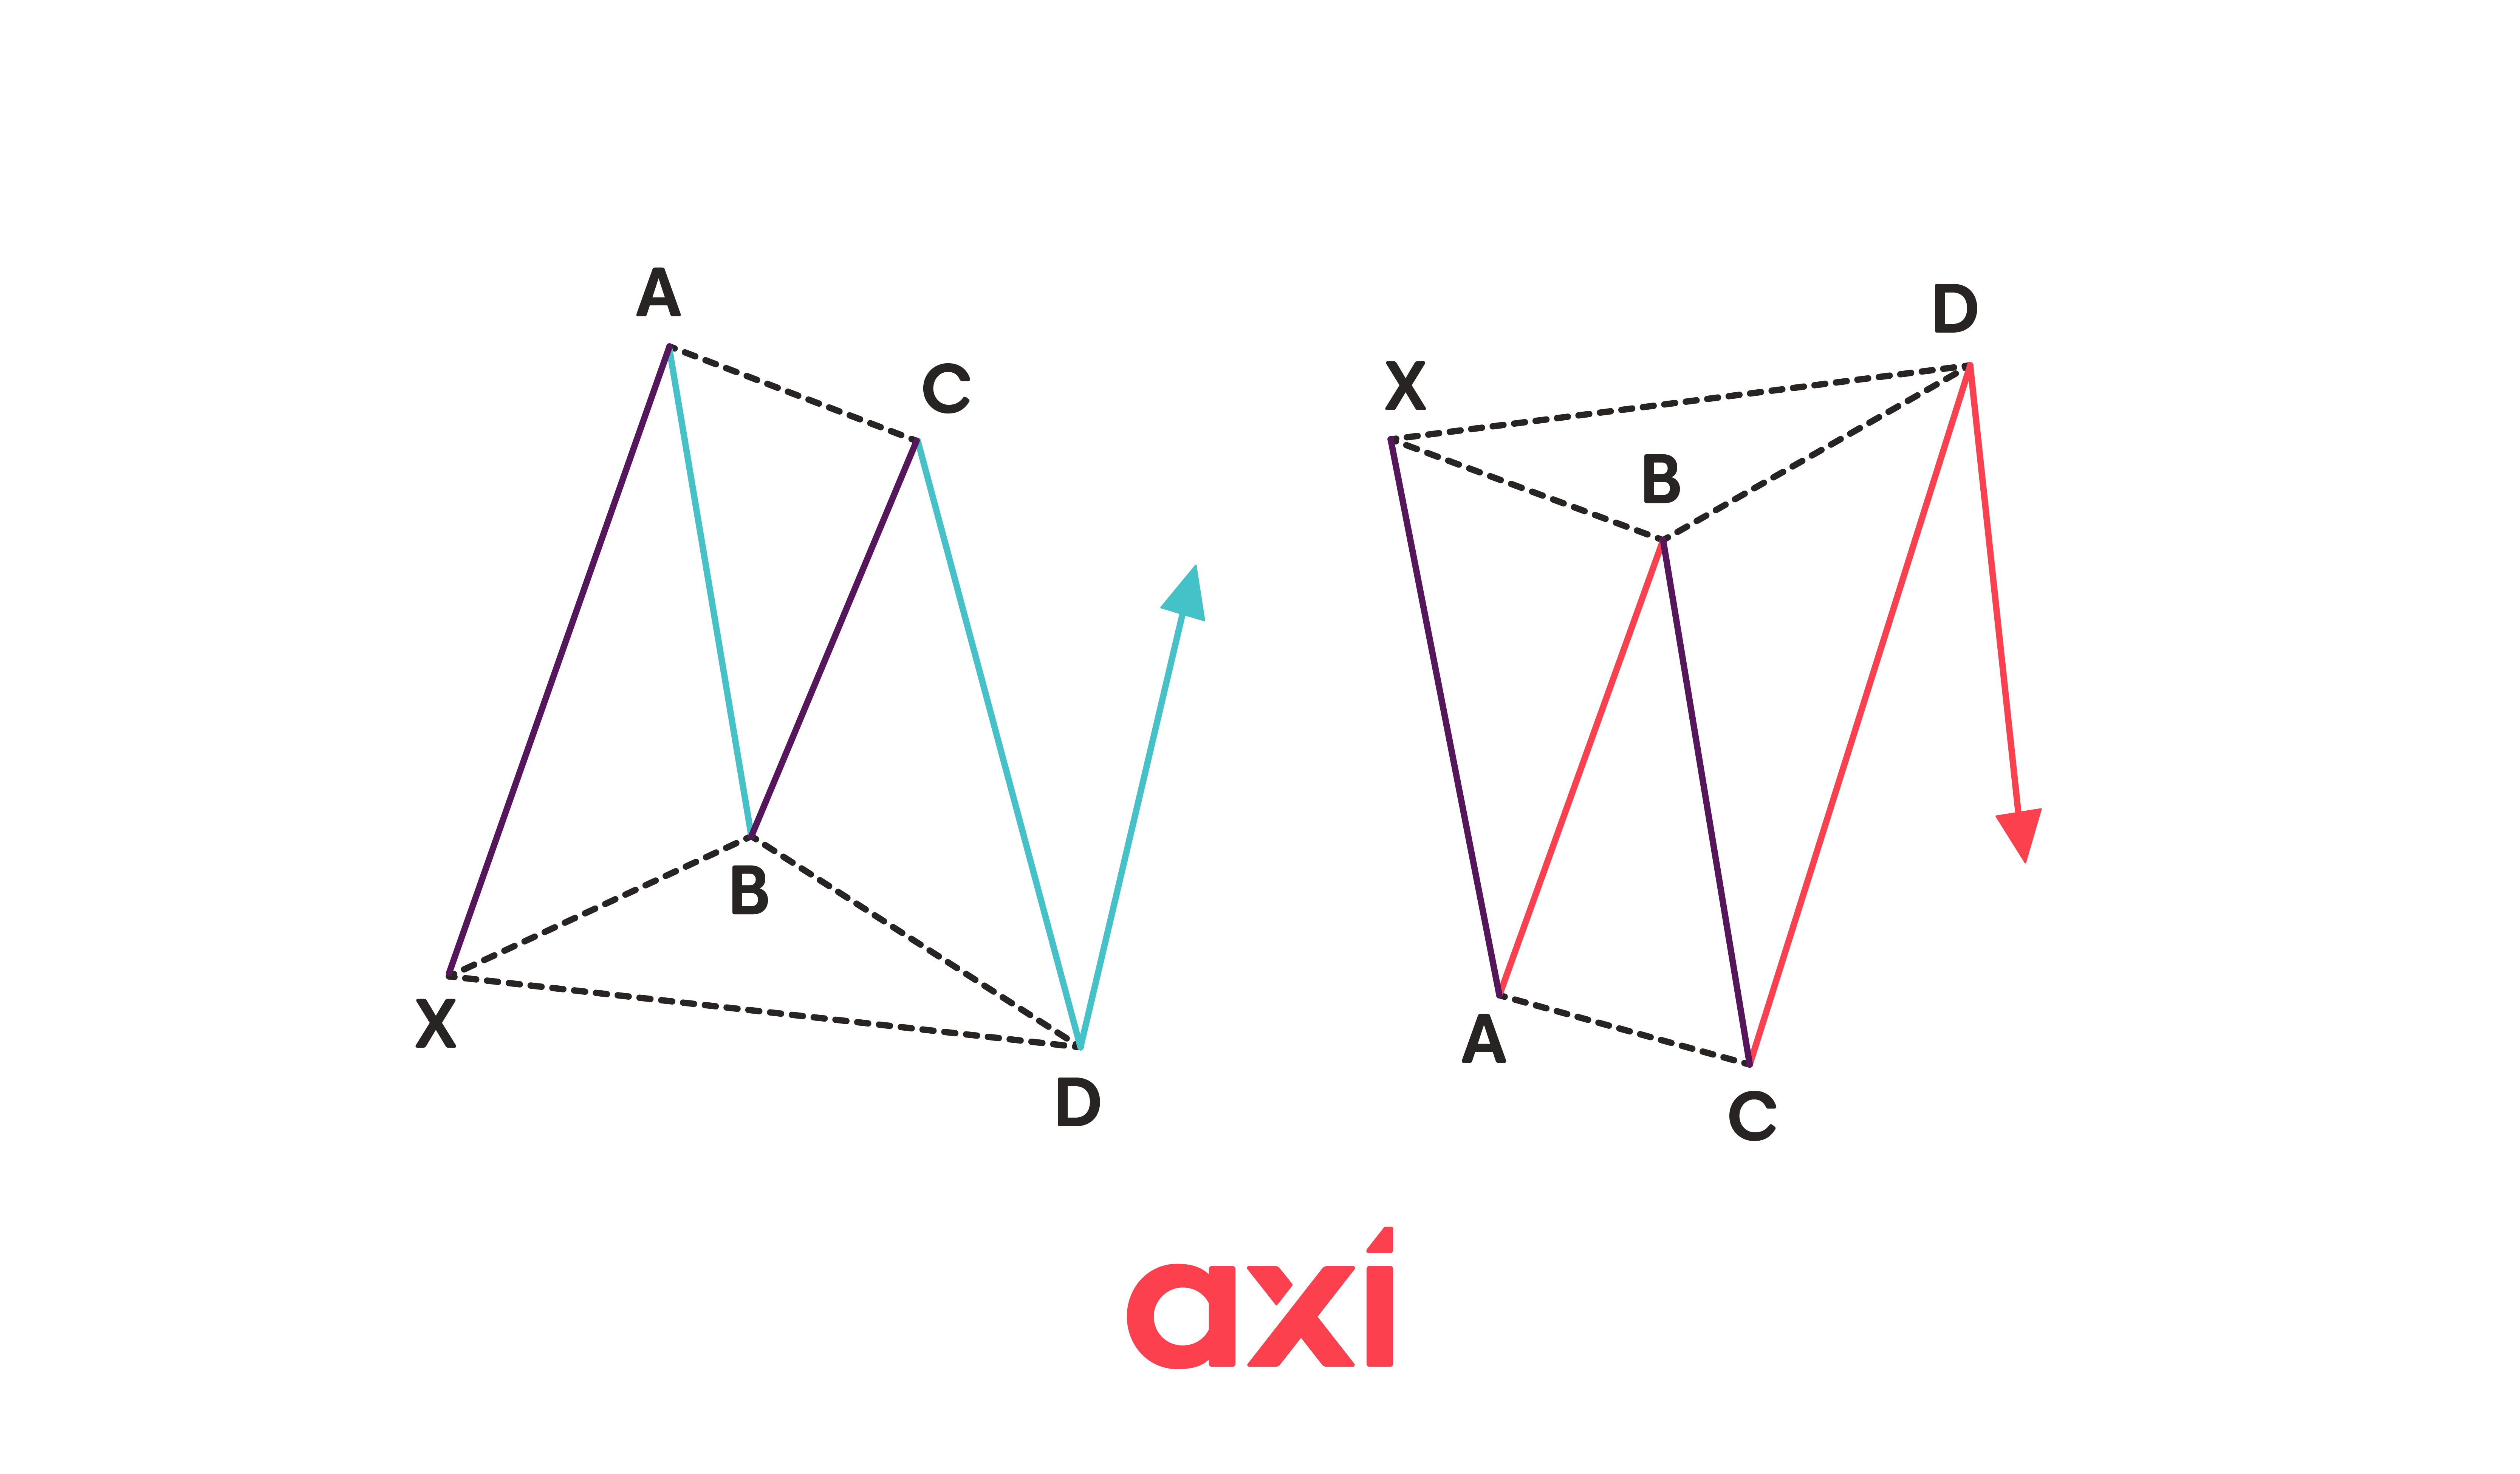 Bullish and bearish butterfly patterns
The Crab pattern
Also a five-point structure: X, A, B, C, D.
- AB = 38.2% to 61.8% of XA
- BC = 38.2% to 88.6% of AB
- CD = 161.8% (or more) of XA
Bullish example: XA is the initial rise, AB a pullback, BC a recovery, and CD a decline stretching beyond X. D is the long entry.
Bearish example: XA is the initial decline, AB a minor recovery, BC another decline, and CD a recovery stretching beyond X. Go short at D.
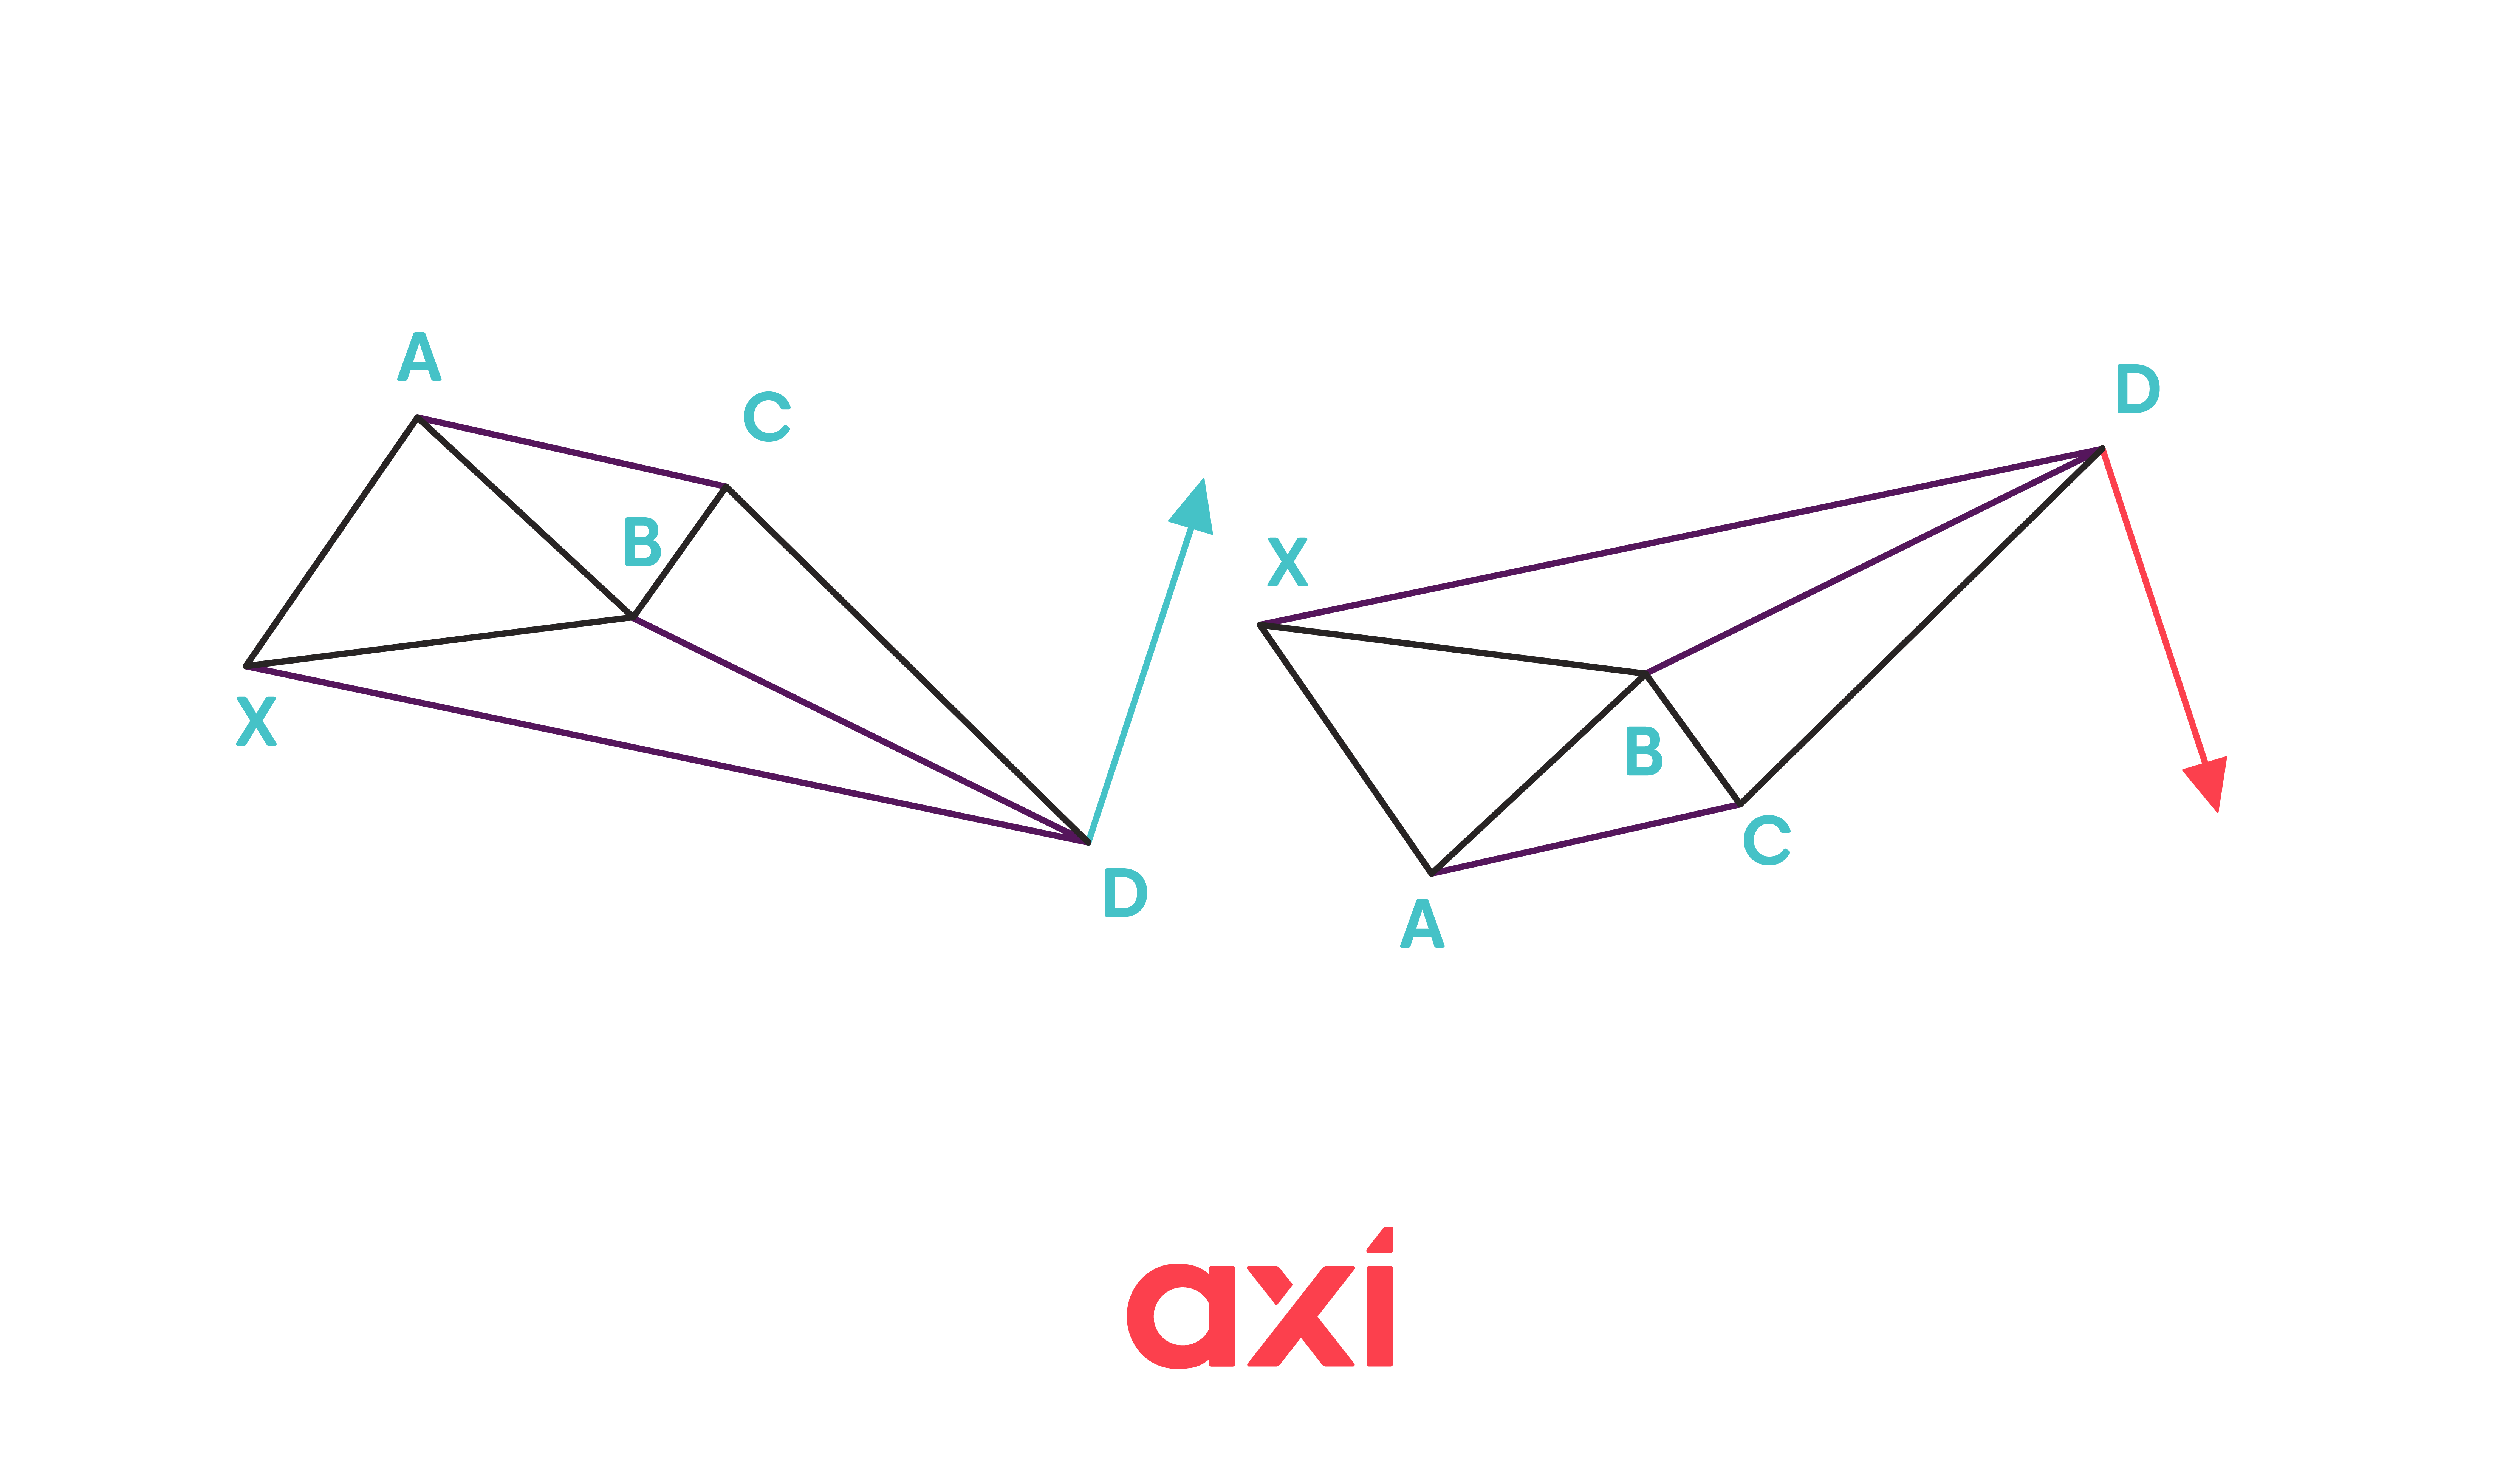 Bullish and bearish crab patterns
The Deep Crab pattern
Similar to the Crab but with a deeper retracement to point B and more extended CD leg.
- AB = 88.6% of XA
- BC = 38.2% to 88.6% of AB
- CD = 224% to 361.8% extension of BC
- XD = 161.8% extension of XA
Bearish version: Resembles the letter "W" with D marking the entry point for a short position.
Bullish version: Resembles the letter "M" with D marking the entry point for a long position.
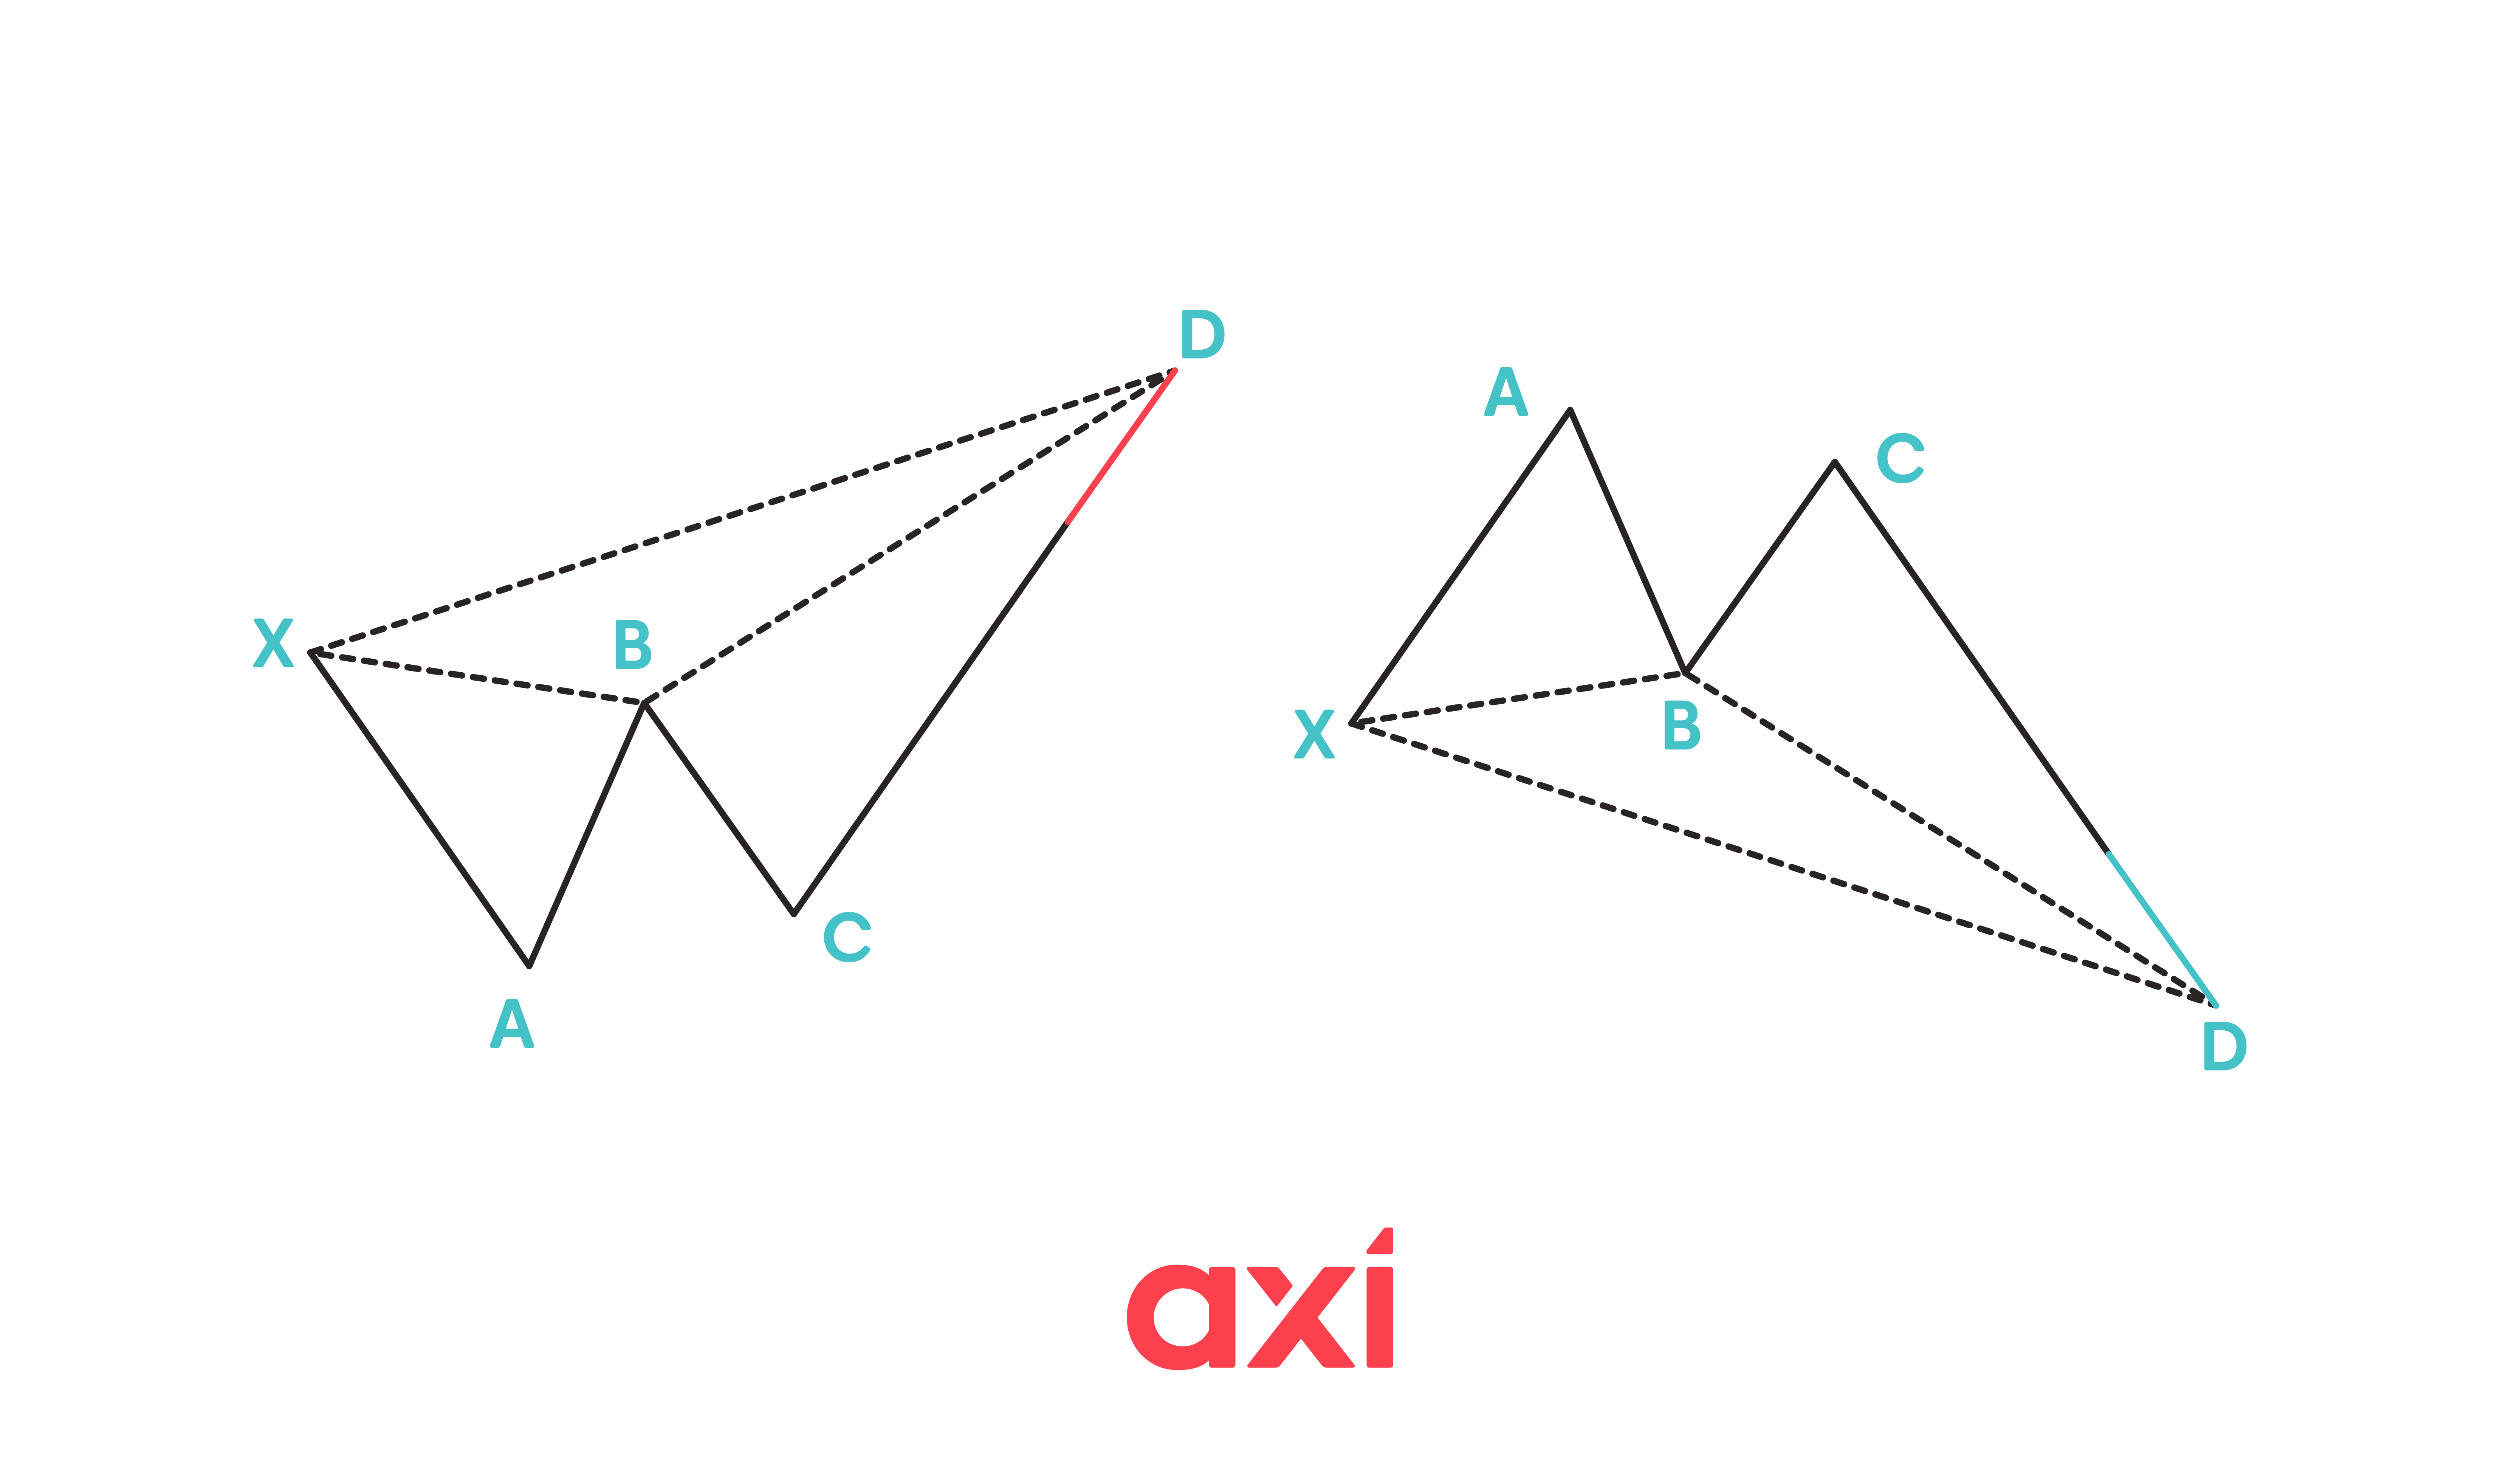 Bearish and bullish deep crab patterns
The Gartley pattern
One of the most well-known patterns, introduced by H.M. Gartley in 1935. It has the following legs:
- AB = 61.8% of XA
- BC = 38.2% to 88.6% of AB
- CD = 127.2% to 161.8% of BC
- AD = 78.6% of XA
Bullish version: Looks like a "M"-suggests a bullish reversal.
Bearish version: Looks like a "W"-suggests a bearish reversal.
The key difference from the Deep Crab is that the Gartley indicates a more moderate pullback.
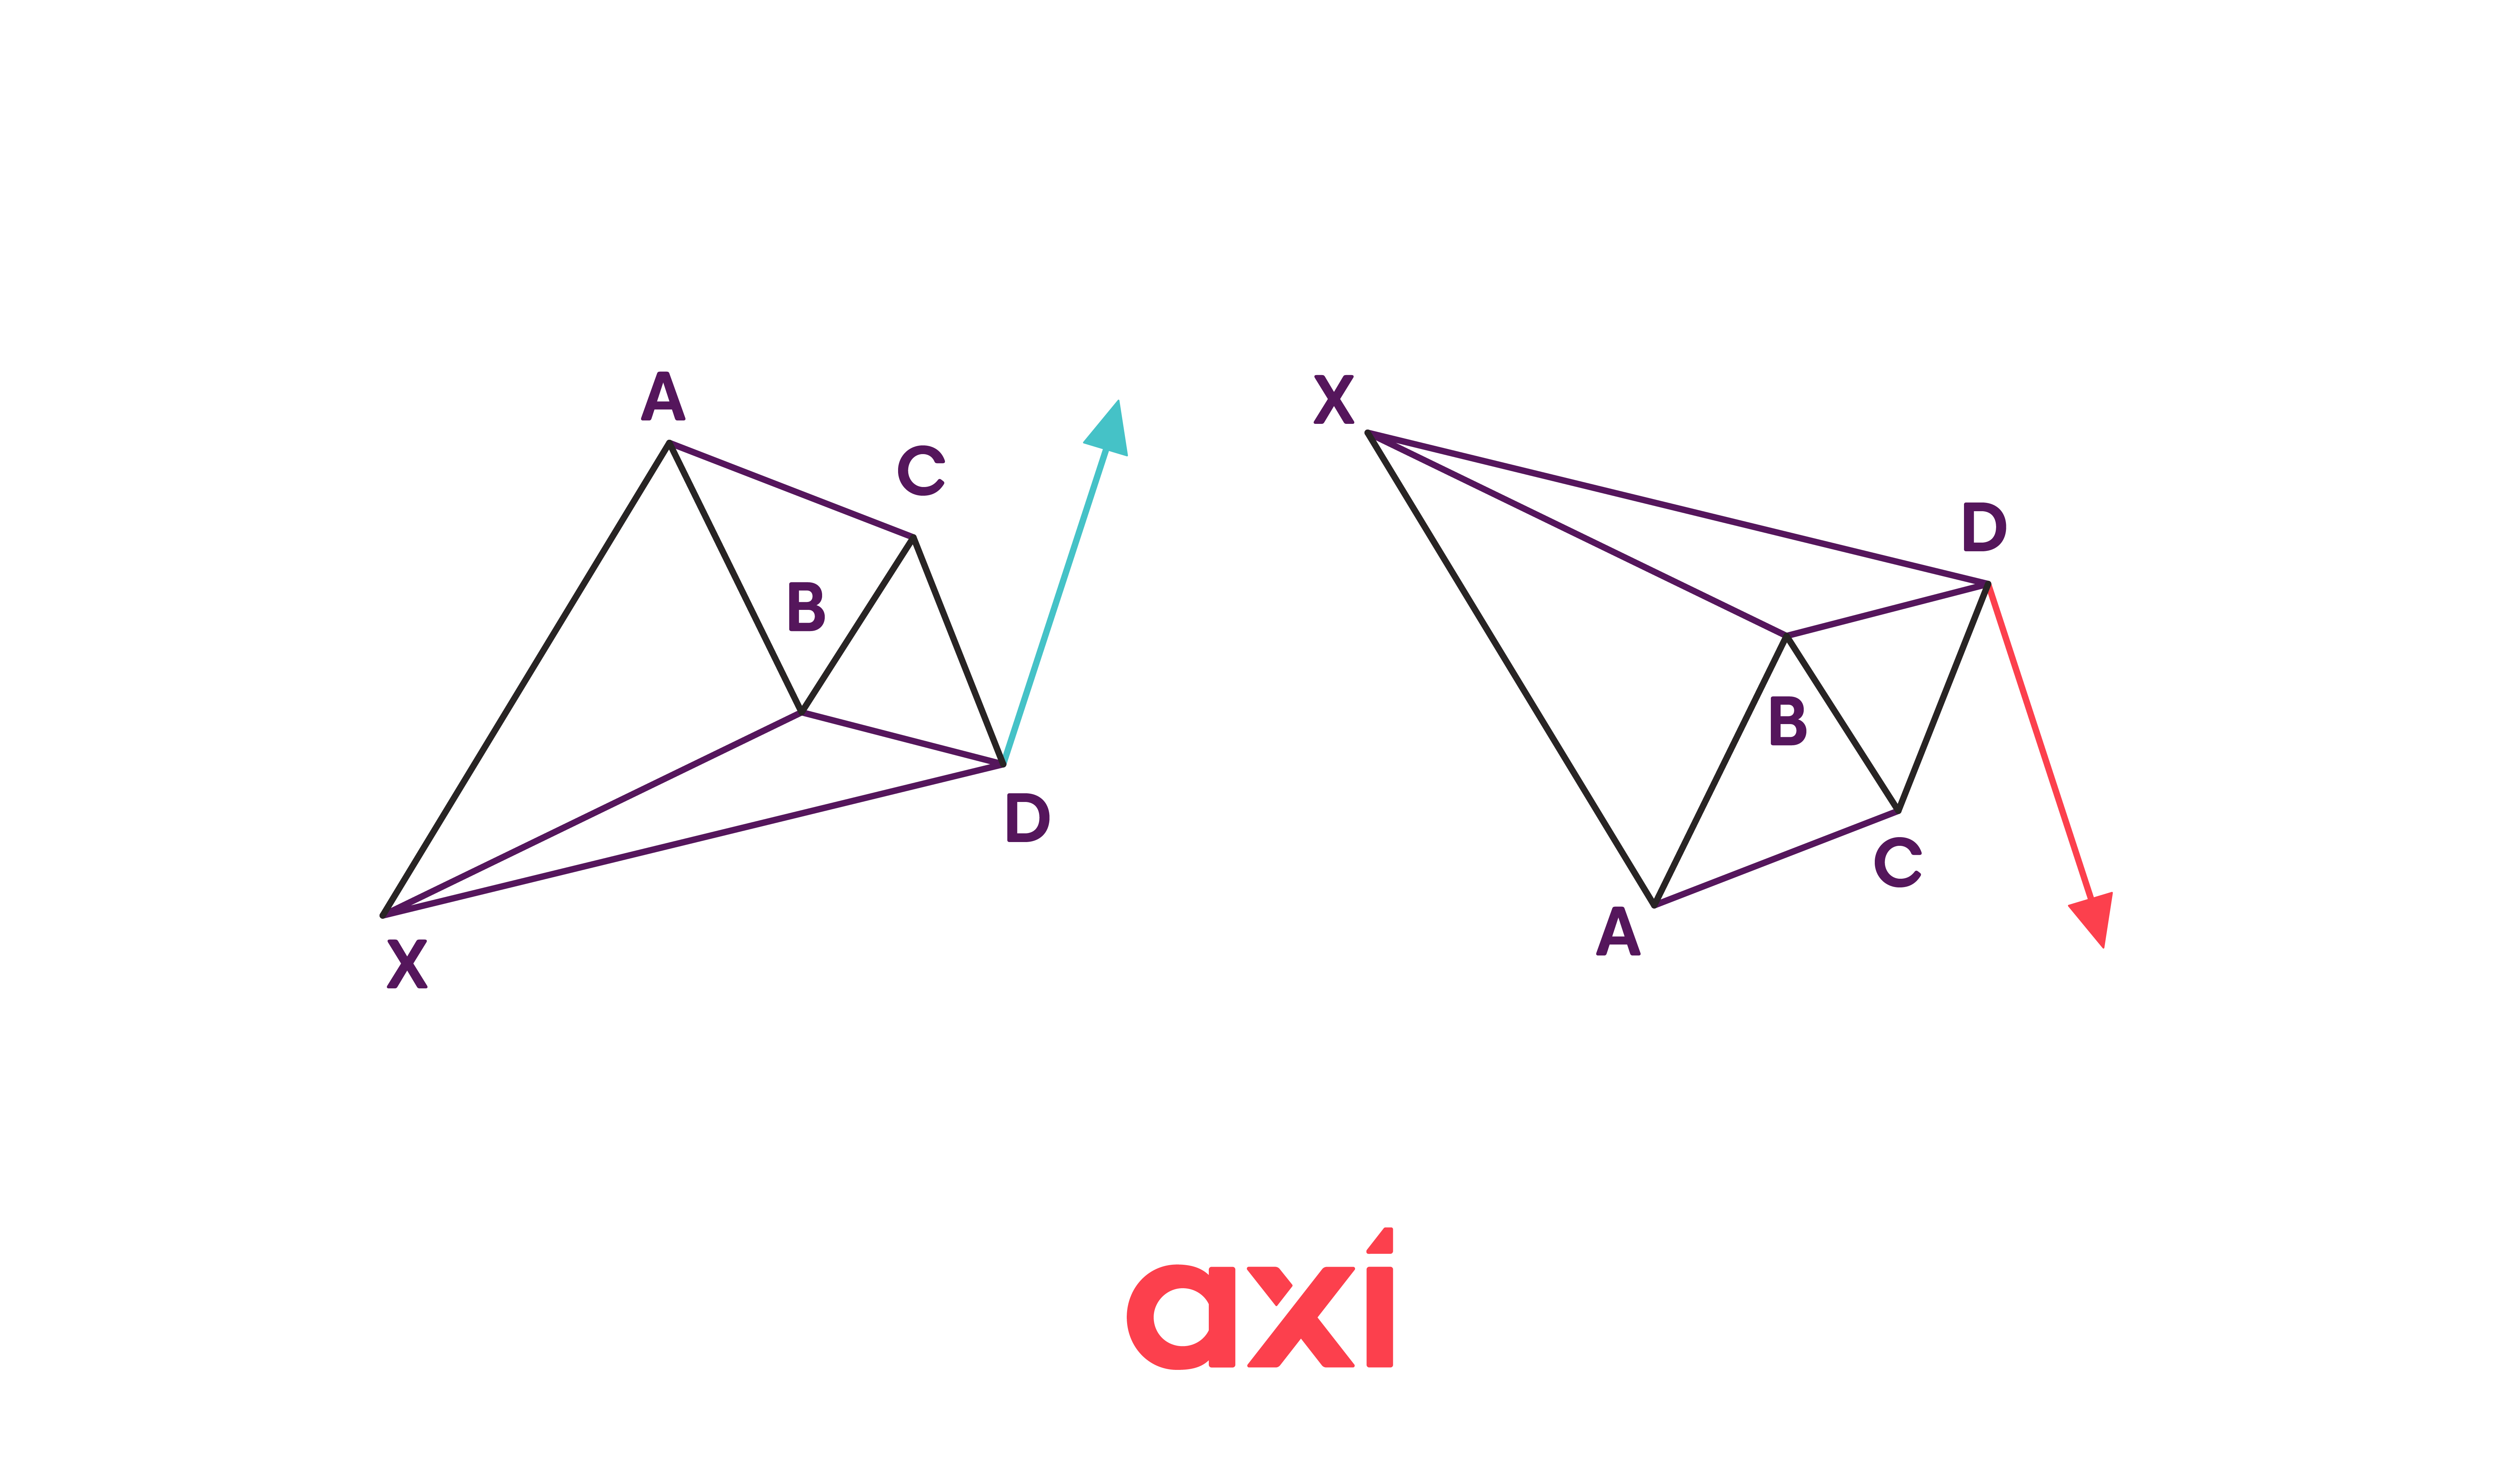 Bullish and bearish Gartley patterns
The Shark pattern
A newer pattern developed by Scott Carney. Points are labeled O, X, A, B, C (with C as the reversal point).
- XA = 113% to 161.8% of OX
- AB = 161.8% to 224% of XA
- BC = 88.6% to 113% extension of OX
Bullish Shark: Resembles a stretched-out "M".
Bearish Shark: Resembles a stretched-out "W".
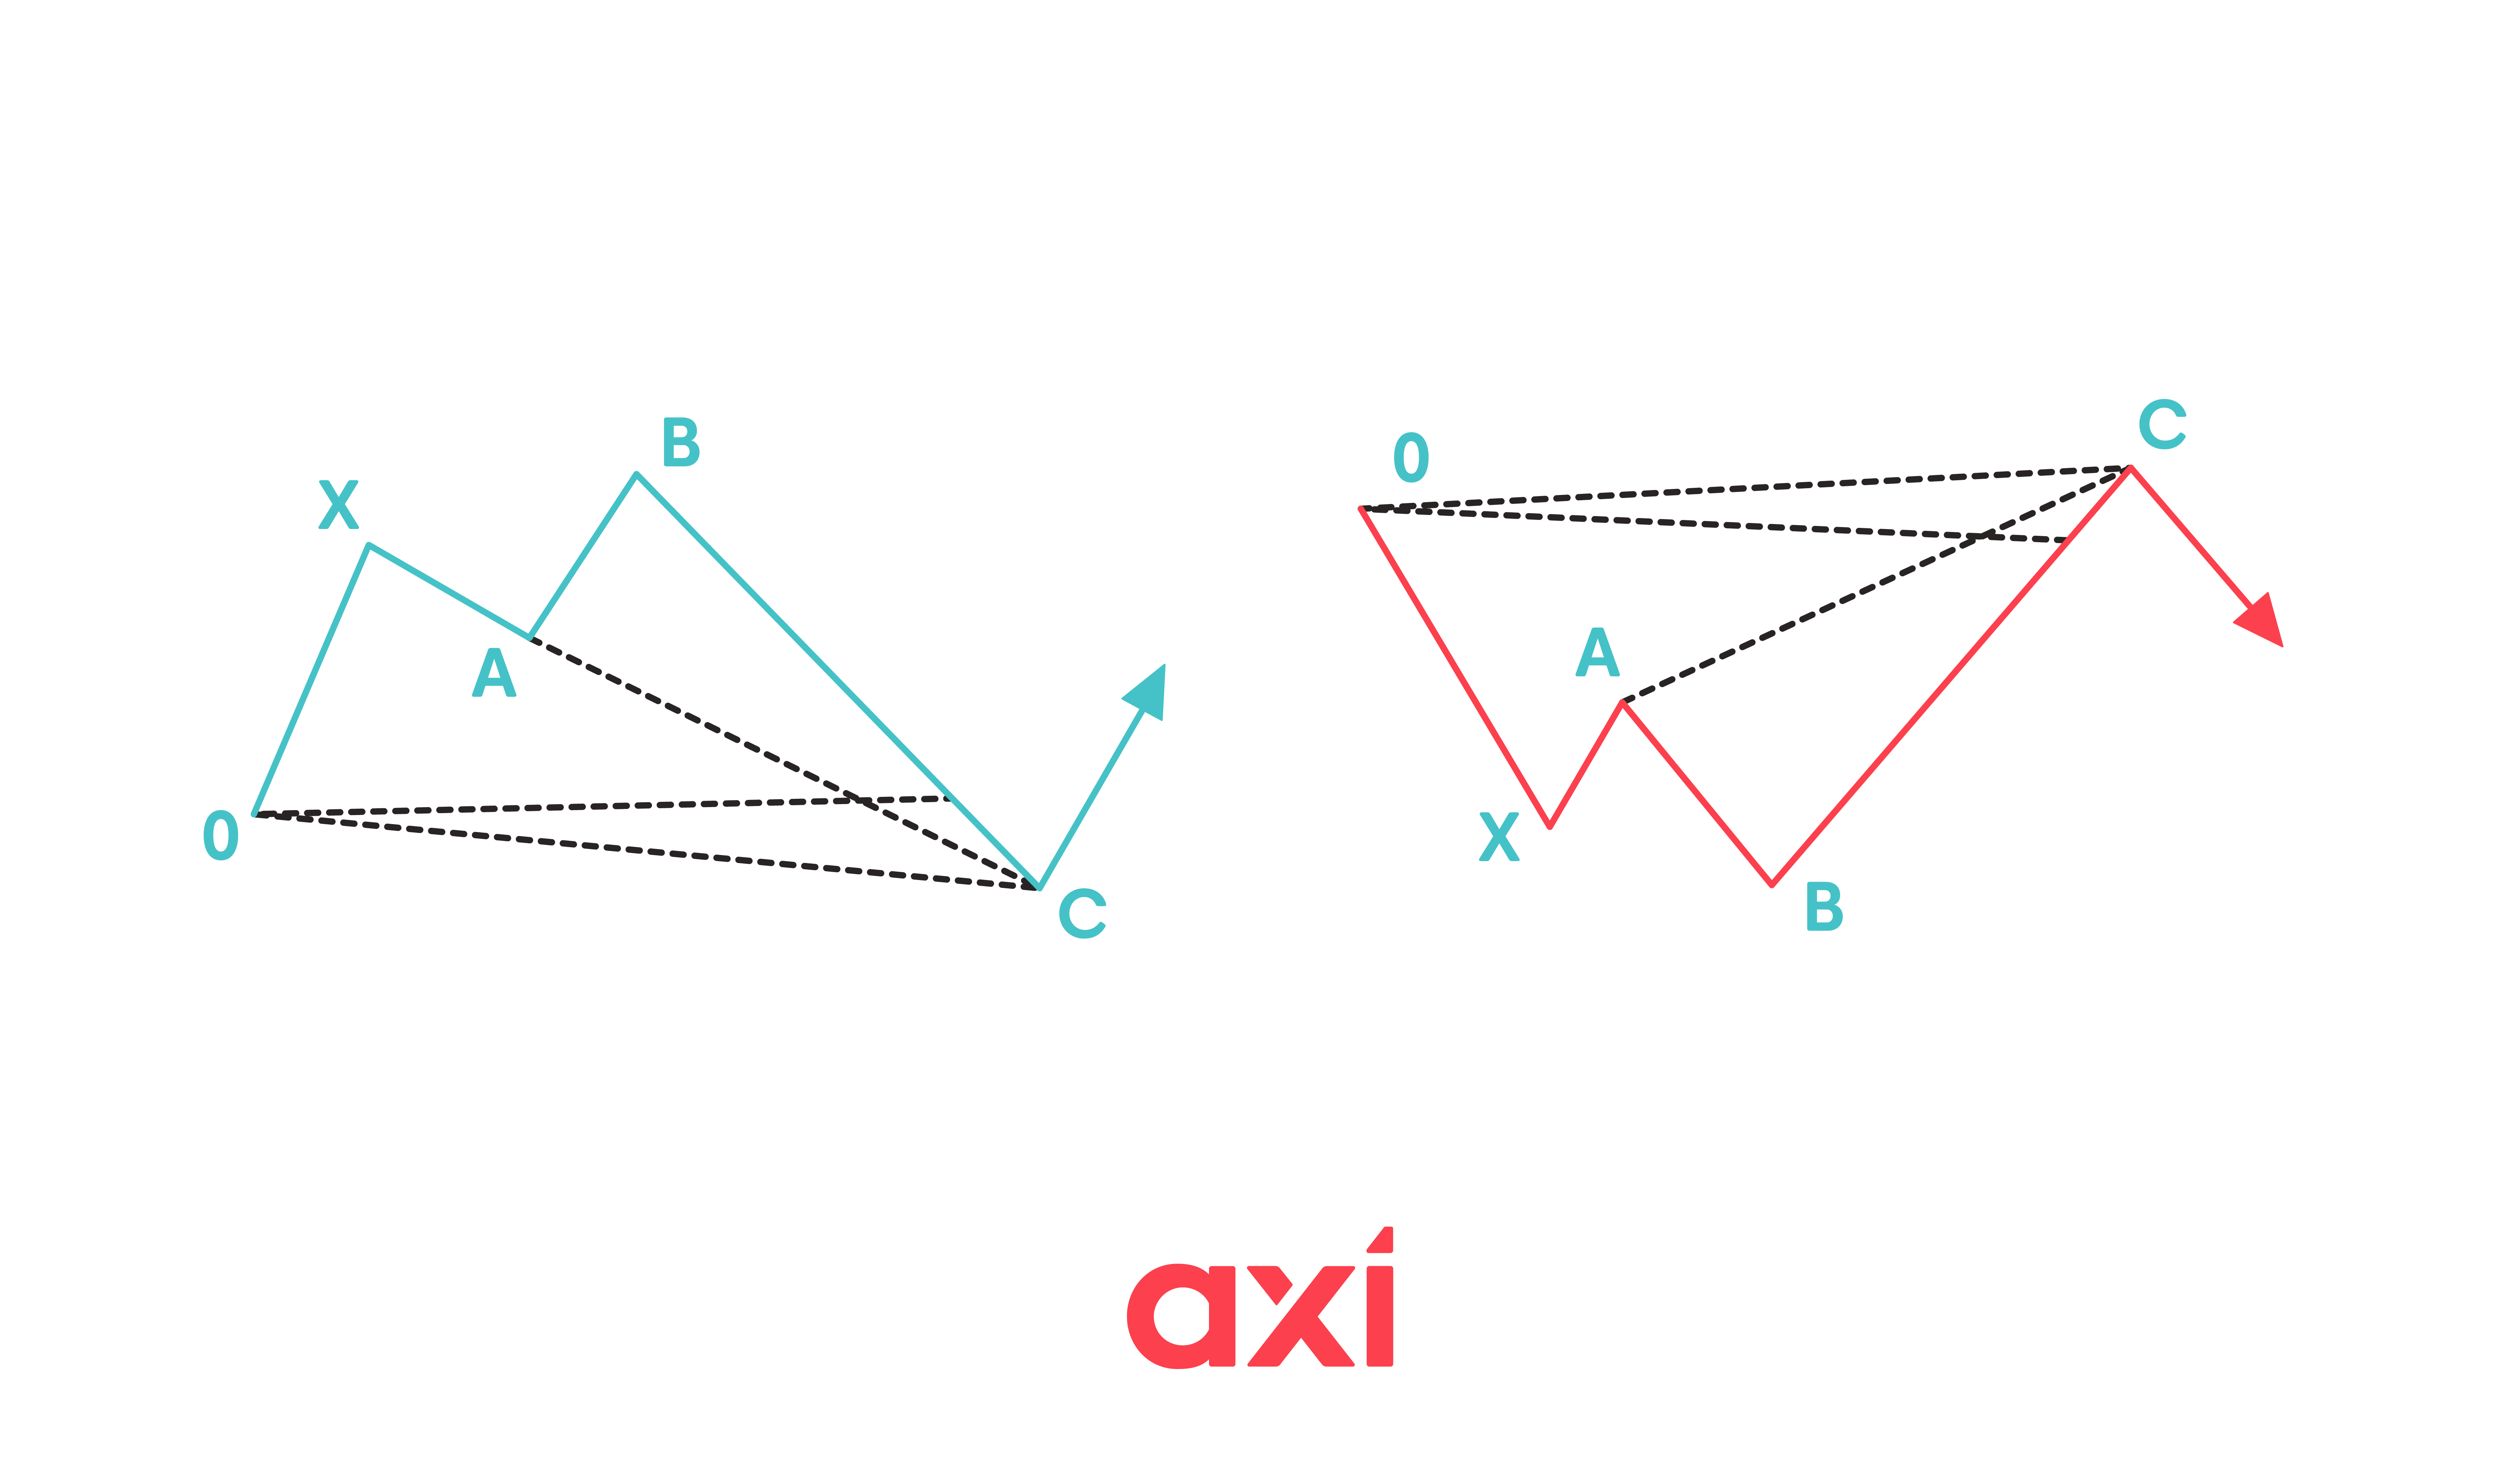 Bullish and bearish shark patterns
The 5-0 pattern
Also by Scott Carney, this often follows a Shark pattern. Points are X, A, B, C, D (D is the reversal).
- AB = 113% to 161.8% of XA
- BC = 38.2% to 50% of AB
- CD = 50% of BC
Bullish 5-0: Flattened "W" shape.
Bearish 5-0: Flattened "M" shape.
Key differences from the Shark:
- Shark starts at point O and ends at C
- 5-0 starts at X and ends at D
- 5-0 has a shallower retracement
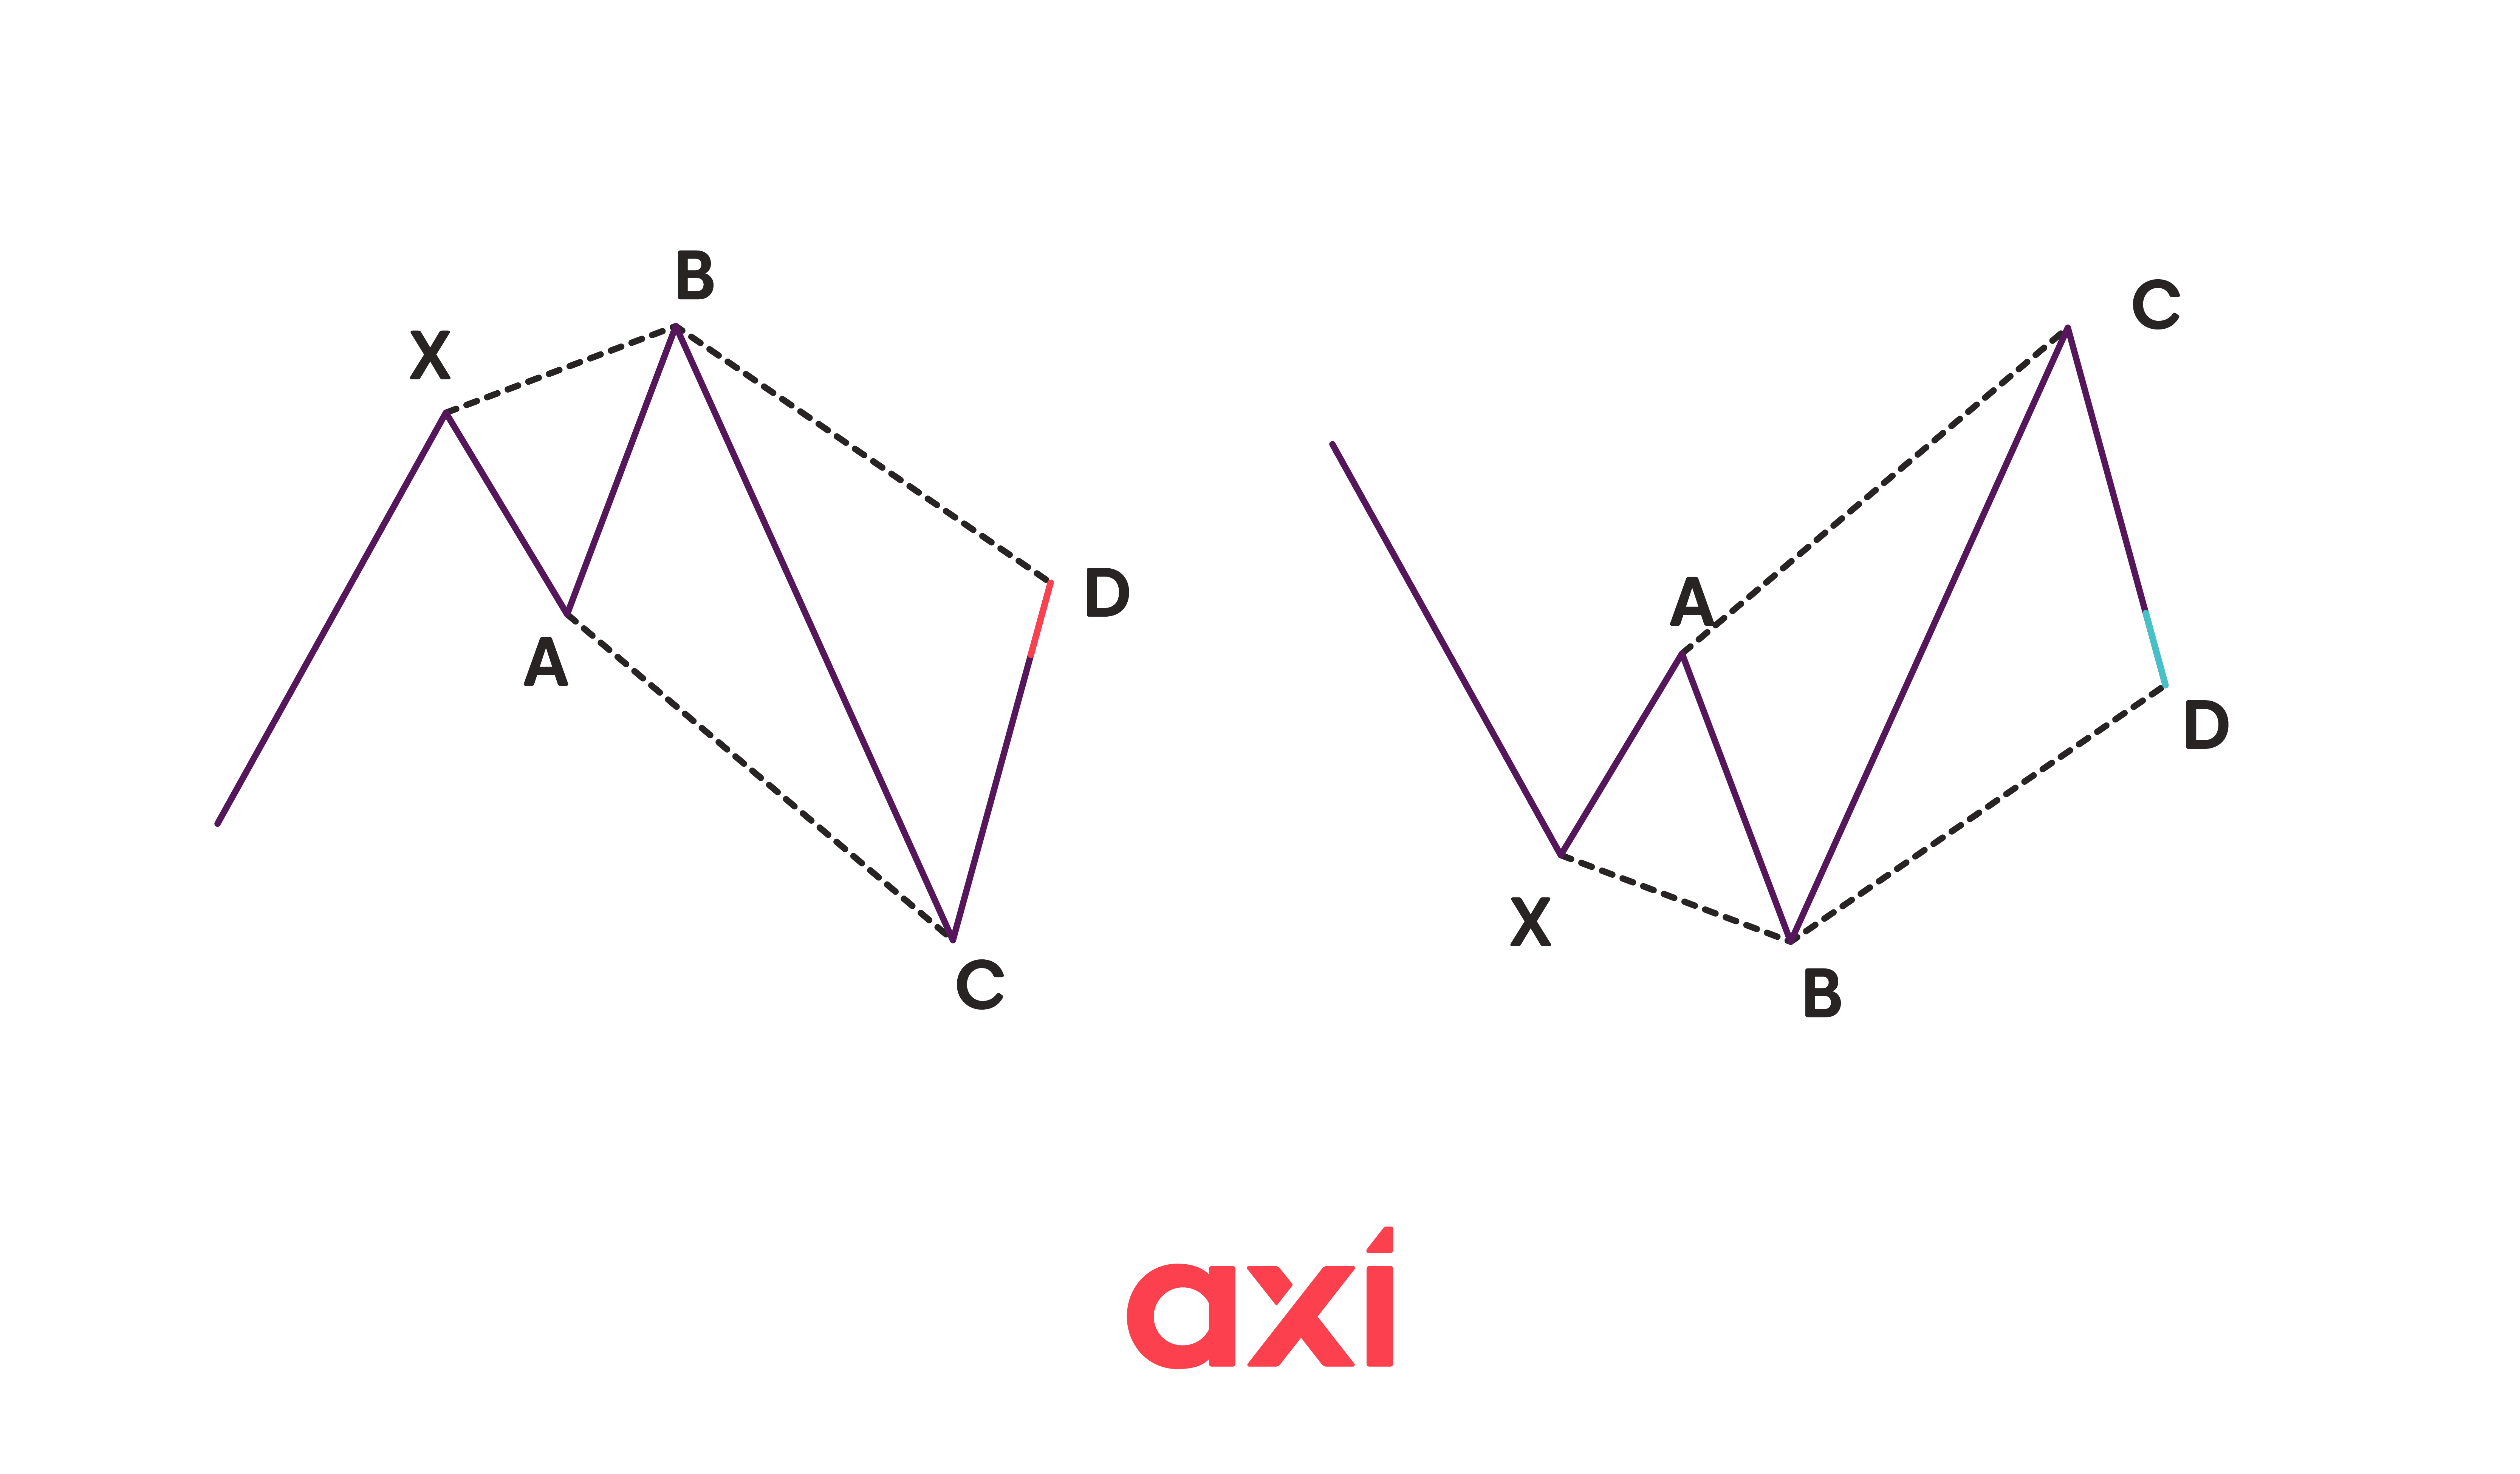 Bearish and bullish 5-0 patterns
How to trade harmonic patterns
The first step is to identify the harmonic pattern. While there are several patterns available, beginners may stick to the ones that are easier to spot, such as Gartley and Bat.
When drawing the harmonic pattern, traders may use a candlestick or a bar chart. You must be able to spot the swing highs and lows that form the shape of the harmonic pattern and verify that the Fibonacci criteria are met. Nowadays, there are plenty of tools that allow traders to automate this part. However, some traders prefer to identify and draw them manually, as it helps with the learning process.
The second step is to identify the point of the reversal. For most patterns, this will be point "D". Traders will be looking to enter a trade as close as possible to point "D" - i.e., buying if it is a bullish reversal pattern or selling if it is a bearish reversal pattern.
The stop loss order is typically set above/below the invalidation point - which would be again point "D" for most patterns.
To set the take profit order, traders will make use of Fibonacci levels again. For example, if D is the reversal point, traders may target a 38.2 % or 61.8 % retracement of the CD leg, or even up to 100 % if they expect a strong move.
As with any chart pattern, technical indicators can be used for additional confirmation. For example, the RSI (Relative Strength Index) can indicate when an instrument is in overbought or oversold conditions, which can aid in decision-making.
Advantages and disadvantages of harmonic patterns
Advantages
- Provide precise entry points using Fibonacci levels
- Less subjective than patterns like Head & Shoulders
- Identify potential reversal points
- Applicable across timeframes and markets
- Compatible with technical indicators
- Can be identified with software tools
Disadvantages
- Complex and require knowledge of Fibonacci ratios
- Time-consuming to learn compared to simpler patterns
- Still some subjectivity in drawing patterns
- Can be overwhelming-better to start with simpler ones
- Like all patterns, false signals can occur
Summary
Harmonic patterns are chart patterns based on Fibonacci levels that help traders identify potential trend reversals. They require precise calculation and are less subjective than simpler chart patterns.
The main harmonic patterns are ABCD, Bat, Butterfly, Crab, Deep Crab and Gartley.
Each pattern consists of points which, connected, form the leg, as well as the reversal point - typically point "D". Harmonic patterns can be both bullish and bearish and appear on all timeframes.
Ready to trade your edge?
Join thousands of traders and trade CFDs on forex, shares, indices, commodities, and cryptocurrencies!
This information is not to be construed as a recommendation; or an offer to buy or sell; or the solicitation of an offer to buy or sell any security, financial product, or instrument; or to participate in any trading strategy. It has been prepared without taking your objectives, financial situation and needs into account. Any references to past performance and forecasts are not reliable indicators of future results. Axi makes no representation and assumes no liability with regard to the accuracy and completeness of the content in this publication. Readers should seek their own advice.

Milan Cutkovic
Milan Cutkovic is an experienced trader and market analyst specializing in forex, indices, commodities, and stocks. He was one of the first traders accepted into the Axi Select program, which identifies talented traders and supports their professional development.
He is passionate about helping others improve their trading skills through educational articles, eBooks, and content published on the Axi blog. His work is regularly featured and quoted in major international media outlets, including Yahoo Finance, Business Insider, Barron's, CNN, Reuters, New York Post, and MarketWatch.